Citizen Scientists

Citizen Scientists

Citizen scientists can improve the waters around us and support scientific initiatives.

Volunteering is a great way to provide useful services to your community. One type of volunteer work that has become very popular in recent years is that of a citizen scientist. You don’t have to be a scientist to do this, but you will learn a lot. According to the  dictionary, citizen science is “the collection and analysis of data relating to the natural world by members of the general public.” You work with scientists who instruct you in the processes of data collections and help you understand the importance and how
it aids in solving real-world problems.

Although there are no precise numbers, millions of citizen scientists around the world are involved in fields from astronomy to medicine to weather. Opportunities are almost everywhere; interested boaters will find many in coastal locations as well as on and under the water.

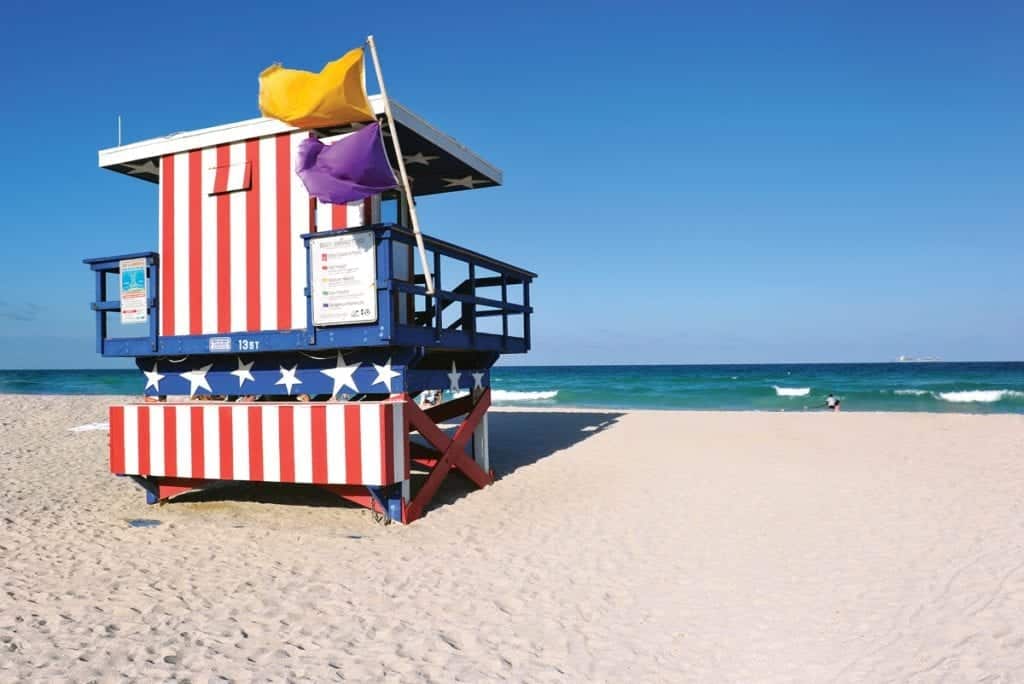
There are numerous organizations for people to get involved, including the Citizen  Science Organization, and participation can be right from your backyard or boat. The National Oceanic and Atmospheric Agency (NOAA) even has a “Citizen Science Day,” along with several volunteer programs. Weather conditions are a major concern for the comfort and the safety of people out on the water and along the coast.

Volunteer Opportunities

  • The MARS Program (MArine Reporting Stations) primarily involves U.S. Coast Guard  Group Stations but also has some civilian volunteers. They report marine weather conditions from shore locations to the National Weather Service (NWS).
  • Commercial vessels with licensed crews can participate in the Voluntary Observing Ship (VOS) Program. These “official observations” are coded into a special format recognized internationally and are crucial to coastal and high seas marine forecasts.
  • Both commercial and recreational mariners can take part in the NWS MAROB (MARine OBservation) Program. A subset of the VOS initiative, MAROB still uses coded observations but not as detailed as a full VOS report.
  • The MAREP (MArine REPort) Program does not require specific training and relies on plain language observations of coastal weather conditions by mariners.
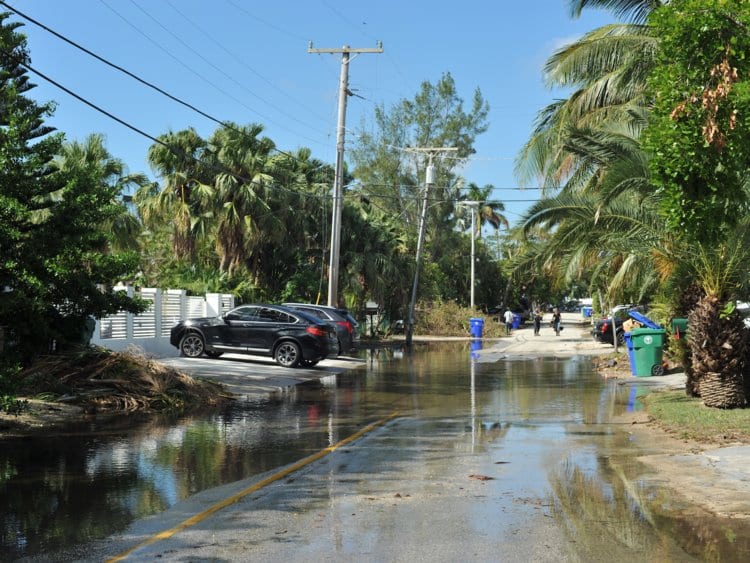
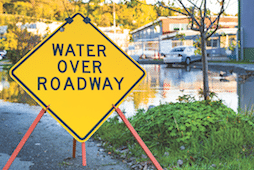
  • A number of coastal NWS Forecast Offices have a Marine Weather Spotters Program. Volunteers are trained to recognize significant weather and ocean conditions and report them to the NWS which can then issue appropriate warnings to the public. Of particular concern are thunderstorms, waterspouts, fog, high winds, unusually strong currents or high tides, and generally rough seas.  Basic training is provided free by the NWS.

To participate in any of these National Marine Sanctuaries (NMSs) have many volunteer opportunities, especially with marine organisms.

What do citizen scientists do?

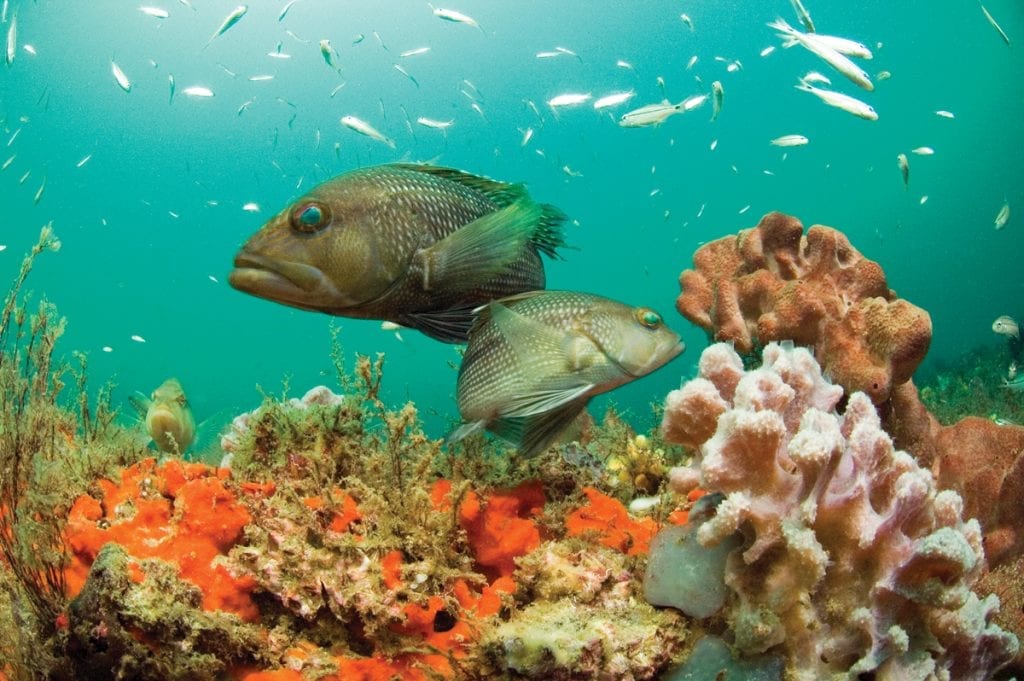
Depending on the location, citizen scientists may monitor water quality, observe and record sightings of various wildlife and marine species, help restore reefs, and more. Contact your nearest NMS for specifics. The Marine Recreational Information Program (MRIP) was designed to provide data for effective management of fisheries. Anglers and boat captains help researchers by participating in surveys. Questions deal with the number of fishing trips taken and the amount and type of fish caught.

There are even questions about the weather. The Florida Fish and Wildlife Council (FWC)
supplements the MRIP surveys with its own Gulf Reef Fish Survey for anglers in the Gulf, who can mail in the survey or use its phone app. FWC biologists may interview you at dockside or even come along with you on boat trips.

Working with Marine Life

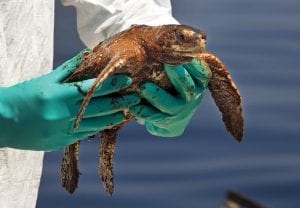
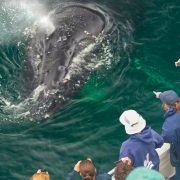
In terms of sightings, there are two species of particular concern: whales and sharks. Several of the NMS locations encourage whale watchers to report their sightings. Whale Alert is a group that tracks whales to lessen the danger of collision with large ships. Mariners and the general public can use an app to record whale sightings. In the Southeastern U.S., you can also use the Dolphin & Whale 911 app to report any injured or entangled marine mammal.

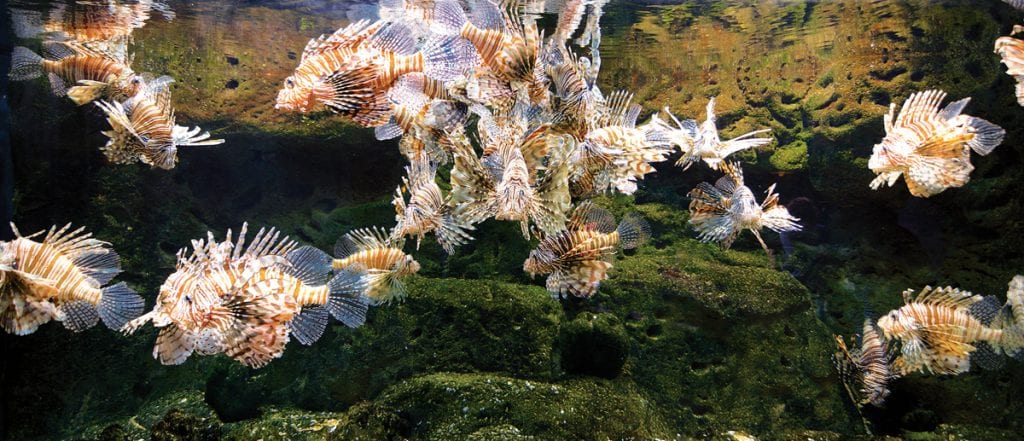
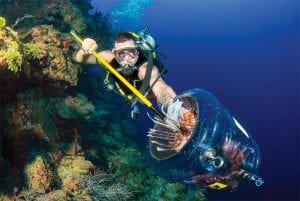
Report shark encounters to Support Our Sharks through its SharkBase Citizen Science program. For the more adventurous, there are shark-hunting expeditions, like the University of Miami’s Shark Research Conservation trips where you can accompany marine biologists on board to catch, record, and tag sharks. The Shark Trust encourages you to record empty shark egg cases you may find.

Volunteers may monitor water quality or track marine life populations.

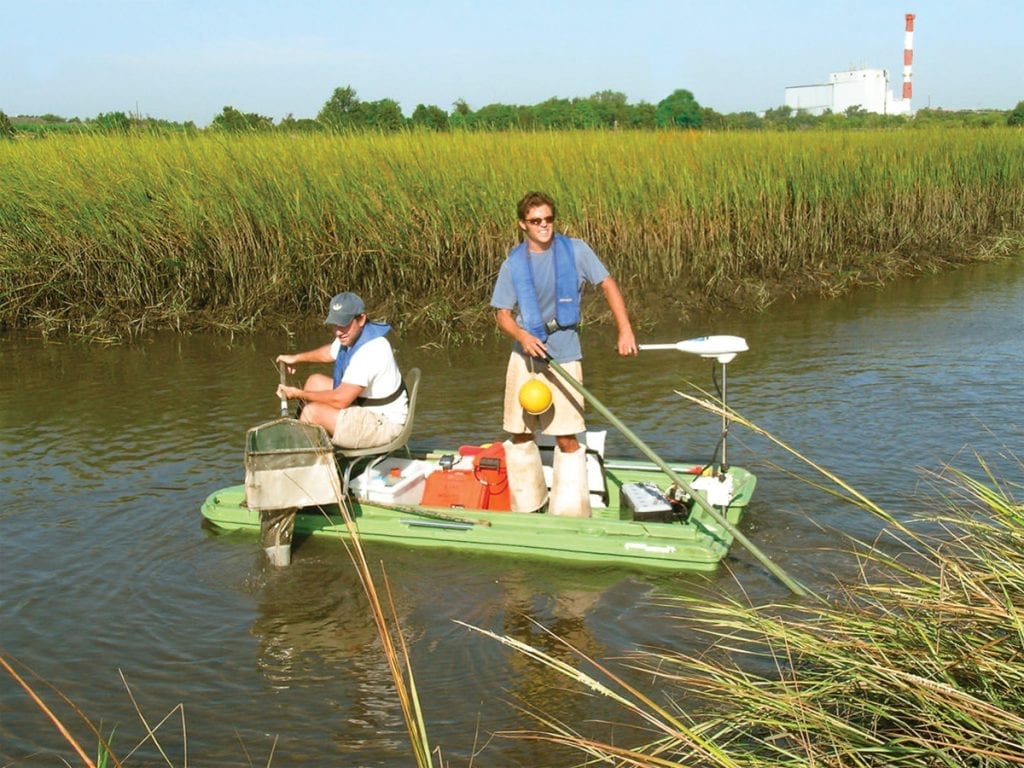
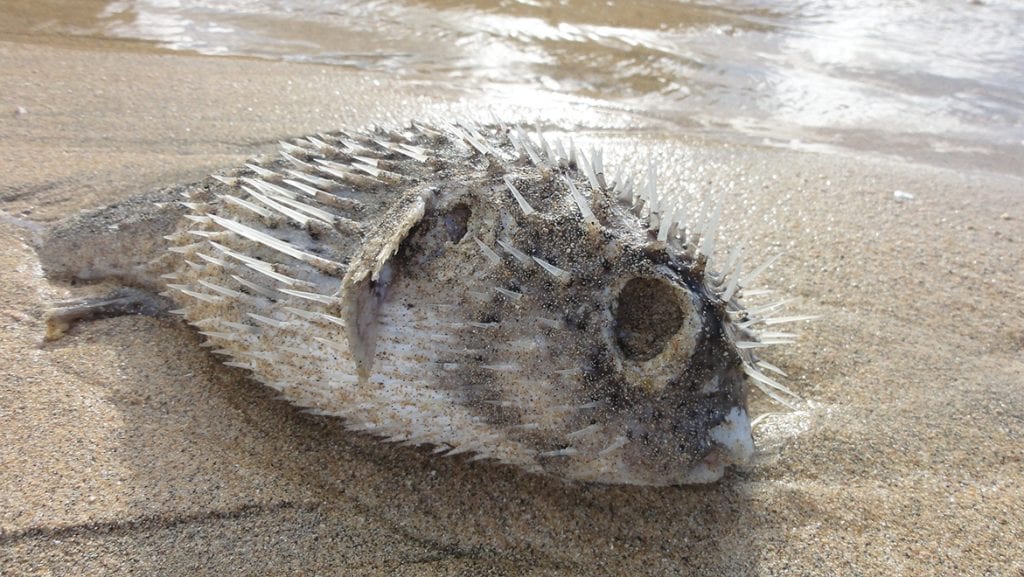
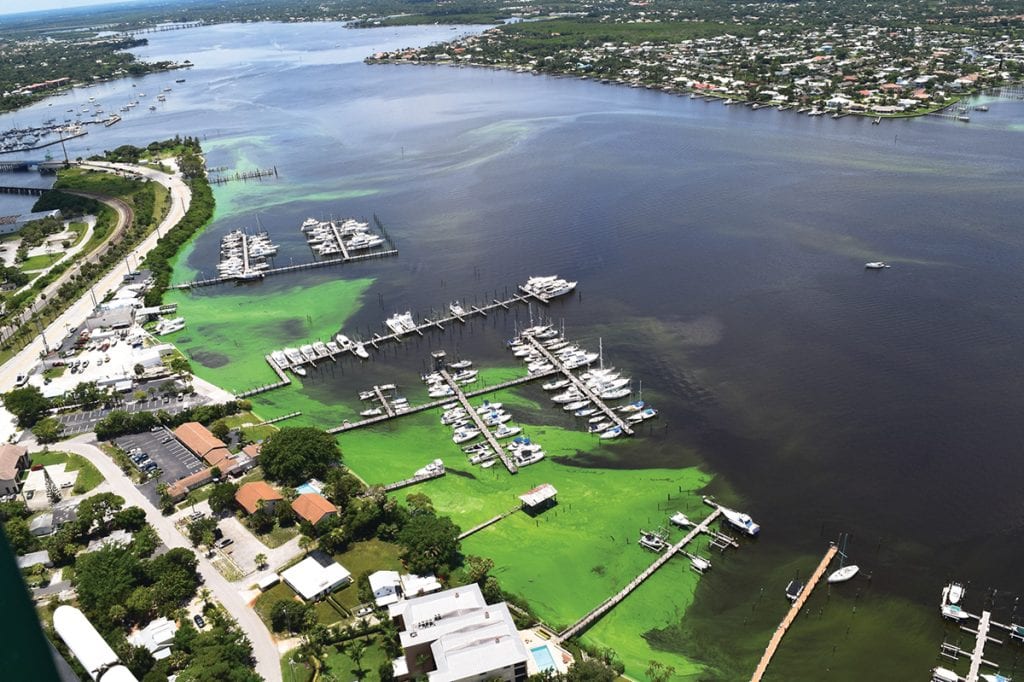
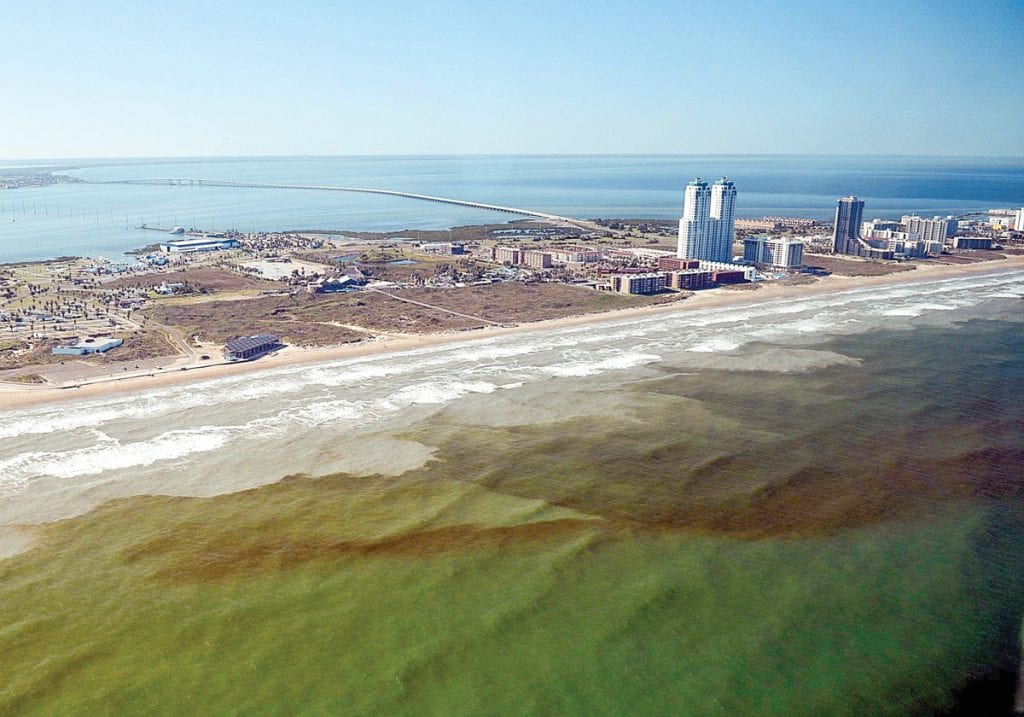
On a smaller, but no less important, scale, NOAA has the Phytoplankton Monitoring Network (PMN) which collects data on potentially damaging algal blooms. Volunteers are taught how to collect and analyze samples using provided tools and equipment. Results are sent to a central office where their findings are verified and distributed as necessary.
A similar Texas-based group of volunteers who call themselves the Red Tide Rangers test for the presence of K. brevis, the red tide algae.
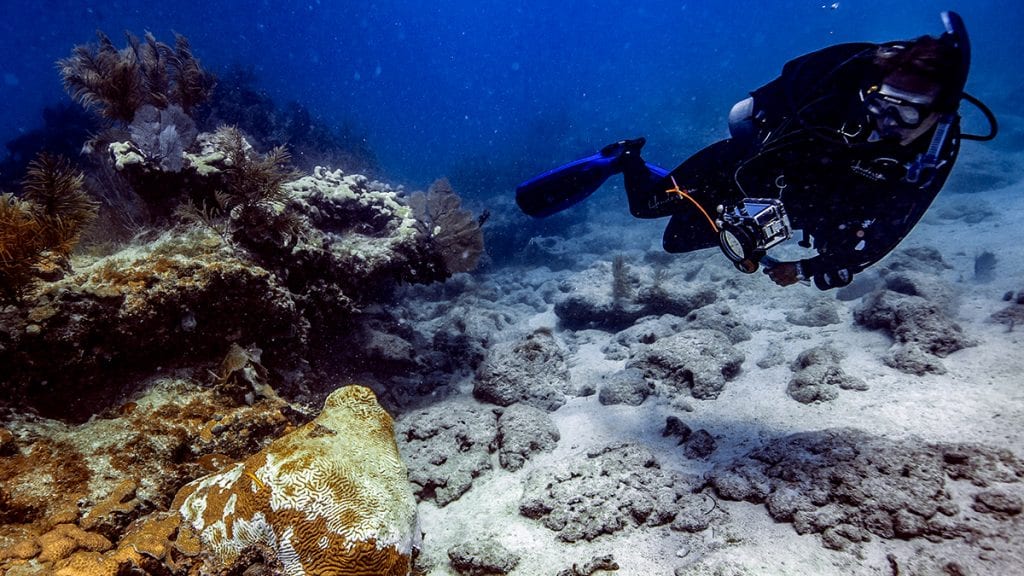
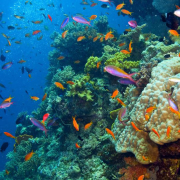
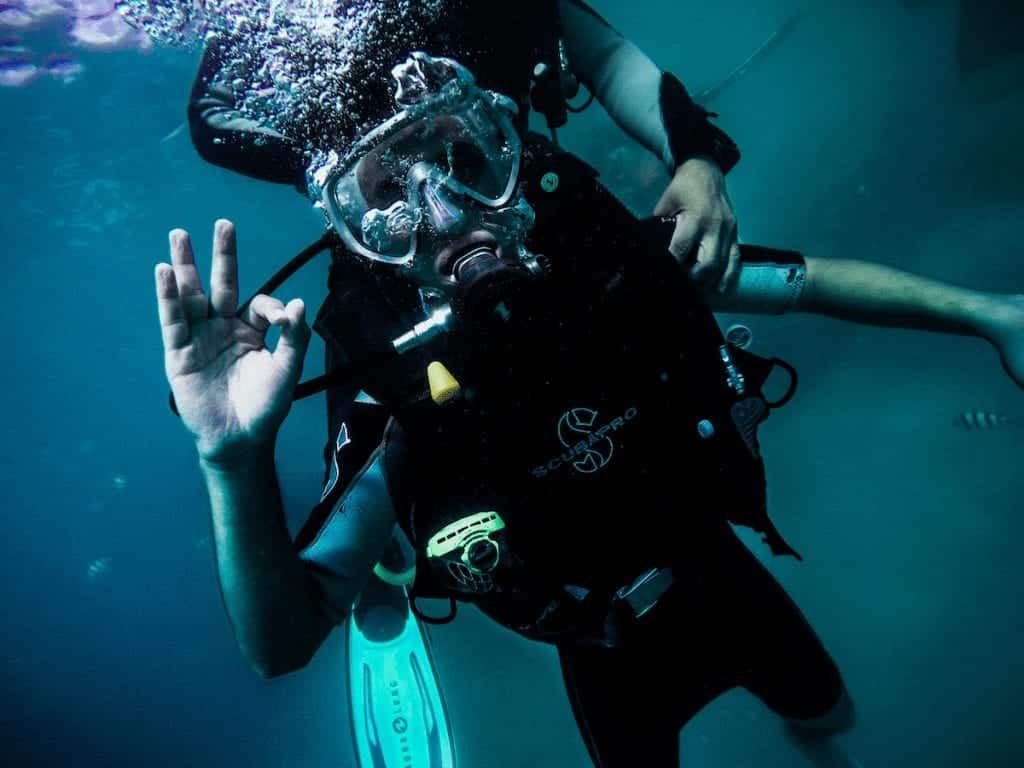
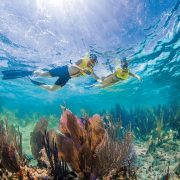
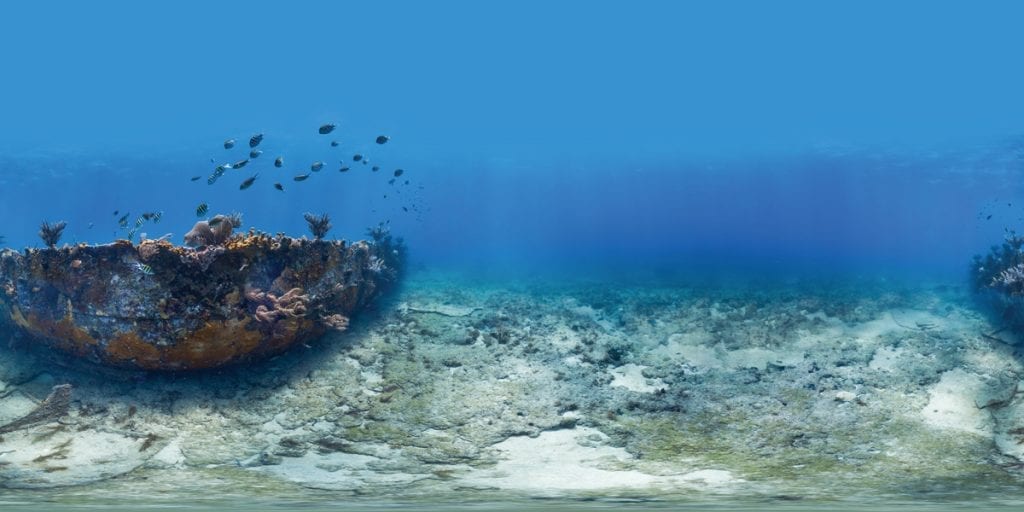
Coral Restoration

Protecting endangered coral reefs has gained a lot of attention in recent years. The University of Miami runs Rescue a Reef expeditions where UM researchers bring recreational divers and snorkelers along on coral restoration projects. The Coral Restoration Foundation is working on fully restoring eight reef sites along the Florida Reef Track. The foundation is actively seeking divers on the reefs to collect and transmit data to them.

Hello Ocean welcomes recreational sailors and others to take readings on ocean acidification, a major factor in coral reef destruction.

This is far from a complete list of citizen science endeavors, but you can see there are abundant opportunities to become a citizen scientist.

By Ed Brotak, Southern Boating September 2019

Marine Education

Marine Education

Boaters know the value of healthy oceans better than almost anyone. Whether your interest is fishing or cruising, no one wants to do it in unhealthy water. Get schooled and brush up on some basic marine education.

September is when schools get back in session, but it’s also a time along the Southeast Coast to learn more about marine education.

Florida Oceanographic Society

A nonprofit organization with the mission to inspire environmental stewardship of Florida’s coastal areas through education, research, and advocacy, the Florida Oceanographic Society offers educational programs to the public. Its 57-acre marine life nature center on Hutchinson Island in Stuart, Florida, between the Indian River and the Atlantic Ocean, conducts research and restoration programs for the improvement of the regional coastal ecosystems. Presentations educate the public on environmental issues, such as protecting coastal ecosystems and marine life.

Learn more: floridaocean.org

Harbor Branch Oceanographic Institute

Founded in 1971 as a premier marine research facility in Fort Pierce, Florida, Harbor Branch is part of Florida Atlantic University. The mission of its team of scientists, engineers, students, staff, and volunteers is to use ocean science to help create a better world. Harbor Branch-FAU’s Ocean Discovery Visitors Center offers a variety of educational opportunities along with a lecture series that enables the community to learn about the marine environment and the important research conducted by the institute.

Learn more: fau.edu/hboi

Smithsonian Marine Station

As part of the Smithsonian’s Natural History Museum, the Marine Station, also located in Fort Pierce, Florida, is a research facility focusing on the marine ecosystems unique to Florida’s offshore waters and the Indian River Lagoon. The facility’s programs study the biodiversity, life histories, and ecology of marine organisms in the lagoon and oceanic waters of Florida’s Treasure Coast. On the third Thursday of each month, the center opens its doors to the public to share its current research projects. The center also holds public lectures throughout the winter where scientists present their work.

Learn more: si.edu/research/smithsonian-marine-station

Mote Marine Laboratory at Florida Keys History & Discovery Center

Research and environmental stewardship are two tenets of Mote Marine Laboratory.

Mote Marine Laboratory comprises scientists and explorers acting as stewards of the ocean. They are driven by research and education to create a better environment for generations to come. Their belief is: “The answers are in the ocean, and together we will find them.” The Mote Laboratory field station at the Florida Keys Discovery Center in Islamorada, Florida, provides a beautiful and educational view of the unique coral reef ecosystem of the Florida Keys and the challenges it faces.

Learn more: mote.org/locations/details/florida-keys-history-discovery-center

The University of North Carolina, Institute of Marine Sciences: UNC-IMS operates a research facility in Morehead City, North Carolina. The Institute’s mission is to serve the
public by conducting cutting-edge research, training young scientists, and providing expertise to governmental agencies and industry. Each Thursday during the school year, a
notable marine scientist will present a lecture on their current research project.

For a seminar calendar: contact Kerry Irish at: irishk@email.unc.edu  or ims.unc.edu/events

By Bob Arrington, Southern Boating  September 2019

National Marine Sanctuaries

National Marine Sanctuaries

NMS’s  preserve our underwater treasures

In October 1972, Congress passed the Marine Protection, Research and Sanctuaries Act. One of the goals of this act was to set up National Marine Sanctuaries (NMSs). These would be the oceanic equivalents of the National Parks, vast undersea areas protected by the government.

Under the direction of the National Oceanic and Atmospheric Administration (NOAA), there are more than 600,000 square miles within the National Marine Sanctuary System. One sanctuary is in the Great Lakes, five are along the Atlantic and Gulf coasts, five along the Pacific coast, one that includes the Hawaiian Islands, and one for American Samoa. In addition, there are two Marine National Monuments: Papahãnaumokuãkea off of Hawaii and Rose Atoll east of American Samoa, both under the auspices of the Office of National Marine Sanctuaries. There are also two NMS designates, one in Lake Michigan and the other in Mallows Bay, Maryland.

Coral reefs are often a component of a National Marine Sanctuary.

How are National Marine Sanctuaries created?

Local communities can nominate locations for an NMS designation. Criteria NOAA looks
for include natural resources or habitat with special ecological significance, maritime heritage resources with special historical, cultural, or archaeological significance, or important economic uses like tourism, fishing, diving, and other recreational activities. Additionally, NOAA will ask if the conservation and management of the resources are necessary. Specifically, are there threats or impacts that could affect the resources? Will research and public education be beneficial?

If NOAA accepts the nomination, the location will be put on a list of possible future NMSs. A lengthy evaluation process (typically years) with much public input will follow until a determination is made. The final outcome is a compromise between protection and use.

Marine National Monuments are physically similar to Sanctuaries, but the designation process is different. These are selected by presidential proclamation and are acted upon much quicker, which is especially important if protection is critical. The purpose of NMSs is to protect valuable resources, whether aquatic life or significant man-made features—humpback whale breeding grounds, coral reef ecosystems, and shipwreck sites have all been included.

What can I do at a National Marine Sanctuary?

It depends on the NMS. Some specific activities are prohibited, while others are regulated and controlled. Educating the public about the importance of an area and what activities are allowed or banned is a preferred strategy. The NMSs are for scientific research and education. The end goal is sound “stewardship of our oceans.

The public is welcome to use and enjoy the various NMSs through activities such as swimming, snorkeling, diving, recreational fishing, boating, and marine life viewing. Many have visitor centers (called Discovery Centers) or Partner Exhibits (nearby educational attractions not specifically tied to the NMS). NOAA’s Office of National Marine Sanctuaries hosts a “Get Into Your Sanctuary” event each year to familiarize the public with NMSs. Find specific event information online. The NMS Foundation also produces a yearly magazine, Earth Is Blue, that highlights activities at the various NMSs.

Where are some National Marine Sanctuaries?

The following National Marine Sanctuaries are along the Atlantic and Gulf coasts, each with their own story.

Gray’s Reef NMS

Gray’s Reef NMS is off the coast of Georgia (19 miles east of Sapelo Island). This large sandstone reef, approximately 70 feet below the surface, is named for the scientist who first described the reef’s flora and fauna. The reef provides easy access to divers and fishermen. Characterized as a “live bottom” reef, Gray’s Reef is home to more than 200 fish species, loggerhead turtles, and even the endangered North Atlantic right whale. For those less adventuresome, “virtual” visits to the reef are available at a number of exhibit partners.

Black Sea Bass at Grey’s Reef NMS.


Florida Keys NMS

Florida Keys NMS protects the third-largest living coral barrier reef system in the world. More than 6,000 species of marine life call the reef, nearby seagrass meadows, and numerous mangrove forests home. There are also an estimated 1,000 shipwrecks within the NMS. An Eco-Discovery Center is located on Key West and houses a Living Reef Exhibit.

Flower Garden Banks NMS

Off the coasts of Texas and Louisiana, Flower Garden Banks NMS is the only NMS in the Gulf of Mexico. It derived its name from the colorful reefs found here, the only tropical reefs within hundreds of miles. The Flower Garden Banks is home to a wide variety of aquatic life, such as eagle and manta rays, hammerhead sharks, and even an occasional whale shark.

Monitor NMS

Designated in 1975, the nation’s first National Marine Sanctuary is the Monitor NMS.  Here—just 16 miles off the coast of Cape Hatteras, North Carolina— is where the Monitor, an ironclad warship from the Civil War era, was discovered. There are multiple shipwrecks close by in the “Graveyard of the Atlantic,” including ones from World Wars I and II. The Mariners Museum is in nearby Newport News, Virginia.

Mallows Bay-Potomac River

Mallows Bay-Potomac River on the tidal Potomac River in Maryland is still in the designation process to become an NMS. Like the Monitor NMS, Mallows Bay is the repository of many shipwrecks, such as the “Ghost Fleet,” with more than 100 World War I-era wooden vessels. It is also an ecological trove of fish and wildlife including rare and endangered species.

Stellwagen Bank

The northernmost NMS is Stellwagen Bank NMS at the mouth of Massachusetts Bay. Named for U.S. Navy Lieutenant Commander Henry Stellwagen, who first surveyed the area in 1854, the Stellwagen Bank is a sand and gravel plateau with nutrient-rich waters that provide for an abundance of marine life, most notably whales. In fact, Stellwagen Bank is one of the best whale-watching sights in the world. Additionally, there are many shipwrecks here, as it was once a major shipping route.

By Ed Brotak, Southern Boating August 2019

Summer Beach Safety

Summer Beach Safety

A day of family fun can quickly head south if you’re not careful, so practice summer beach safety.

A day at the beach is a perfect family activity. But to make sure nothing spoils that fun day, remember that safety should always come first. Here are some things to have on your summer beach safety checklist.

Before you head out, check the beach forecast available from many media sources but usually derived from the National Weather Service’s (NWS) Surf Zone Forecast. Officially, the surf zone extends from the high tide level on the beach out to the seaward side of the shoreline’s breaking waves, typically the area for beachgoers.

There are certain weather hazards highlighted in the forecast. I have discussed thunderstorms, waterspouts, tropical cyclones, and even fog, but two of the more innocuous weather hazards present on seemingly great weather days involve the sun and the heat.

Not So Fun in the Sun

Sunlight contains ultraviolet (UV) rays that can cause a painful sunburn or even worse, skin cancer. The greatest risk occurs when sunlight is at its strongest, generally around
midday. Summer is the worst time for exposure. You can absorb UV rays even on days with a light cloud cover. The forecast will usually include the UV Index, which gives a
number to your risk. Values over 6 indicate a high risk of harm to unprotected skin, and values over 10, which are common in the summer, represent extreme risk with skin
damage likely within minutes.

For protection, use sunscreen (SPF 30 or higher) or sun protective clothing (UPF 30 or
more) with a wide brim hat and sunglasses. Heat alone can make you sick, sometimes seriously, and because the body cools itself by evaporating sweat, the amount of moisture in the air—the humidity level—is also important. The Heat Index combines these two factors into a “feels like” temperature. A heat index of 105 or higher is considered the Danger Zone and is often reached in summer.

Pay Attention to Conditions

To avoid heat-related issues, stay out of the sun as much as possible. It can be 10 to 15 degrees hotter in full sunlight. Limit outdoor activities during the warmest part of the day.
If you are active, take frequent breaks, wear light-colored clothing and always drink plenty of fluids. The beach forecast will also typically include water conditions, such as wave heights, tide information and water temperature. In terms of danger, the NWS may issue a High Surf Advisory or Warning.

An advisory signifies that  “breaking wave action poses a threat to life and property within the surf zone.” Actual criteria for issuance vary by region. A warning denotes a  “heightened threat to life and property within the surf zone.” The forecast will also include the risk of dangerous rip currents. Local beach patrol or lifeguards will post warning
signs if rip currents are present as will television and radio weather reports. Many popular beaches have beach cams which make it easy to go online and see conditions before you head out. For long trips, you may want to check local newspapers, etc., to find out if any unusual weather phenomenon is happening.

Know Your Flag

Beaches with lifeguards or those under supervision will display colored flags that depict water conditions. A green flag means it’s safe to swim. A yellow flag indicates moderate surf and/or currents. Weak swimmers should wear life jackets or stay out of the water. Better swimmers should still use caution. A red flag warns of high surf and/or currents. Any swimming is discouraged but not forbidden. A total beach closure would be indicated by a double red flag (or sometimes a sign showing a red circle with a line crossing through it over the image of a swimmer). If dangerous marine life is present (jellyfish, stingrays, sea lice, etc.), a purple flag will fly. Shark sightings would prompt a red or double red flag.

Awareness

Besides the wave or current action, sometimes the water’s condition is problematic. Pollutants or a harmful algal bloom can pose a health risk. Something as major as the red
tide will have warnings on various websites and beach forecasts. An advisory in these cases cautions people that they go into the water at their own risk. If conditions warrant,
a beach closure may be ordered for public safety.

If everything appears okay and you go in the water, you should still beware of “sneaker waves.” These are considerably larger waves. Sneaker waves occur along the beach or coast. They are actually quite common and remain small enough to just be a nuisance. Larger ones, however, can sweep people walking on the beach into the water.

Check Yourself

Suppose you are on a secluded beach with no lifeguard or signage. You must make the call if it’s safe. Surf and water conditions require observation and good judgment. Remember the tips for spotting rip currents: anything floating on the water, such as seaweed, foam or debris that is moving quickly out to sea, an area where the water color is decidedly different from its surroundings, an area where there is a break in the incoming waves or a noticeable channel where the water is churning and/or choppy.

Unfortunately, these indicators may not be readily apparent, or they might not exist at all.
Above all, never swim alone. If you can’t get the latest weather information, check the
skies. Look for the development of puffy cumulus clouds. This means thunderstorms may occur. See which way the clouds are moving to know if you’re at risk. Listen for thunder. If you see a lightning bolt, start counting until you hear thunder; every five seconds means a mile away.

The NWS recommends seeking shelter if a storm is within six miles. Always have a plan, a safe place to go or an exit strategy if bad weather threatens to avoid spoiling a fun day.

By Ed Brotak, Southern Boating, July 2019

How Will Climate Change Impact Fishing?

How Will Climate Change Impact Fishing?

As our waters warm, seas rise and fish move. Climate change impacts fishing below the surface.

Climate change affects our oceans, particularly sea level rise, which, in turn, affects things below the ocean surface, where the results are harder to see. Aquatic life adapts to these changes. Some species may migrate in search of the environment that best suits them. Other species may become less productive and may even face extinction.

Decreasing populations will impact commercial, sport and recreational fisherman, but most importantly, a vital food supply. Marine and coastal fisheries are a $200 billion industry and support nearly two million jobs; any major changes are concerning.
Climate change impacts the oceans a number of ways. Of paramount importance for sea life is increasing water temperatures.

Troubling Times

In fact, the ocean is warmer today than at any time since record-keeping began in 1880. Water has a high heat capacity. It is believed that the oceans store 90 percent of the excess heat generated by the greenhouse effect. On an even more troubling note,
the rate at which the oceans are warming is also accelerating. This has a harmful effect on aquatic organisms who are sensitive to relatively small variations because water temperatures rarely change.

A graphic outlines how dead zones form in our waters.

In addition to increasing water temperatures, there is more carbon dioxide in the atmosphere that dissolves into the water; seawater is becoming more acidic. This means less calcium carbonate for coral reefs to build, a major factor in the destruction of these reefs. Melting ice caps and glaciers, as well as the physical expansion of water at higher temperatures, have caused sea levels to rise, which certainly affects the spawning areas of many fish species.

Variations in seasonal rainfall and individual storm events cause local changes in water
conditions both in terms of temperature and salinity. The amount of dissolved oxygen water can hold, a critical factor for all underwater life, is a function of temperature. Warm water can’t hold as much oxygen, another negative factor for undersea life. The oxygen-devoid “dead zones” we see in the Gulf and elsewhere will likely intensify and expand, just another way that climate change impacts fishing.

High Temps = High Stakes

Nearer the shore, the stakes are even higher. Many fish, such as red drum and sea trout, use bays and estuaries as breeding grounds. Shrimp, oysters and blue crabs are dependent upon them. Unfortunately, the risk of environmental changes is even greater here. With shallow water, temperature changes are more pronounced and happen more rapidly. Salinity is also significantly affected. Heavy rains will bring an influx of fresh water and lessen salinity.

Drought conditions will diminish freshwater inflow and increase salinity. Pollution, especially nutrient pollution, is a major concern in some areas. In conjunction with warmer water temperatures, this will lead to more harmful algal blooms such as red tide. Stronger storms can produce more damage, and the rise in sea level can dramatically alter habitats.

Even the increase in air temperature can change habitats. For example, along the Texas coast and the Florida east coast, black mangroves are moving northward and replacing
cordgrass marshes. One comprehensive study looked at the predicted geographic distribution of nearly 700 marine species in the Atlantic and the Pacific out to the year 2100 for a number of different climate scenarios. Most, but not all, species shifted poleward, generally following the adjacent coastline.

Many species were forecast to migrate more than 500 miles from current locations because of the higher temperature predictions. A study on the effects of climate change on the Gulf of Mexico fish populations yielded mixed results with some species benefiting and some suffering. Red and gray snapper and red porgy benefited from habitat expansion, whereas, Spanish mackerel were likely to move to deeper, cooler waters. Another study forecast pink shrimp Gulf habitat to decline by 70 percent by 2100. It also predicted that species from the Caribbean may move north into the Gulf.

The Times, They Are A-Changin’

Changes are already taking place. The oyster catch along the Gulf coast of Texas is down significantly. Butterfish are replacing herring in the Gulf. Atlantic cod have decreased by more than a third. Black bass, which concentrated off the North Carolina coast, are now most abundant off New Jersey. The lobster population in the Gulf of Maine has increased dramatically with warmer water temperatures, and blue crabs have also moved in.

Fisheries are among the first industries affected by climate change. Coastal communities feel the brunt of the economic impacts. Fishermen may have to travel much farther to
find the preferred species or just give up on it. Regulations on fishing that worked in the past will become obsolete if not counterproductive. Jurisdictional disputes, even up to
the international level, may result. The increase in ocean temperatures will likely continue, and the effects on sea life may even become more pronounced.

Climate Change Impacts Fishing

The NOAA Fisheries Climate Science Strategy was developed to provide pertinent climate information and predictions to those involved with fisheries so they can prepare to deal with and manage climate changes. In conjunction with Rutgers University, NOAA Fisheries developed the OceanAdapt web-tool to provide easy access to information about the distribution of marine species involved in commercial and recreational fishing over time. Wise management of our ocean resources is our only option. We must keep a constant watch on what is going on under the water’s surface and change policies accordingly.

By Ed Brotak, Southern Boating June 2019

Shallow Water Blackout and Electric Shock Drowning

Shallow Water Blackout and Electric Shock Drowning

As the weather warms, it’s time for many of us to get back in the water. There are, however, risks. Two of the lesser known but very dangerous situations are shallow water blackout (SWB) and electric shock drowning (ESD).

Shallow Water Blackout

SWB is when a person blacks out while underwater due to breathing irregularities, such as hyperventilating before you go under and holding your breath too long while under. SWB
can quickly lead to drowning. SWB can affect any swimmer, even highly trained and
fit athletes. In fact, it’s often the better swimmers who can succumb. Besides competitive swimmers who limit breathing to increase speed, those who hold their breath to go underwater, such as snorkelers, spear fishermen and free divers, should be aware of  SWB. Hyperventilation, before you go under, can hasten the effect. Even breath-holding games can be dangerous.

See how SWB occurs in swimmers and divers.

What causes SWB? When you hold your breath, a lack of oxygen to the brain, officially known as hypoxia, can result. This may cause a blackout. At the same time, elevated levels of carbon dioxide will make you take a breath which can lead to drowning if you take in water and it infiltrates the lungs. Just the lack of oxygen itself can result in significant brain damage and even death. Hyperventilation and repetitive breath-holding
increase the risk.

SWB can happen in any situation when you’re in the water. The term shallow water was a reference to incidents that occurred when free divers were ascending from deep dives. SWB is particularly dangerous because it can strike a victim without any warning or precursory signs. Rapid unconsciousness not only prevents you from taking action, but there will also be little sign of your distress to others unless they are close to you.

Because brain cells have already been deprived of oxygen due to the breath-holding, brain damage can occur within a few minutes—much faster than with typical drowning
incidents. Swimming in warm water will also hasten these effects. To prevent SWB, avoid hyperventilating and prolonged breath-holding and never swim alone. Even if a lifeguard is on duty, SWB can strike too quickly for them to help.

Electric Shock Drowning

Like SWB, ESD is a little known but very real danger for swimmers. Even a low-level AC current permeating the water can cause muscular paralysis and an inability to use your arms and legs. Drowning can occur quickly, and a stronger current may induce electrocution.

There is no way of telling if this situation is happening because there are no visible signs. Numerous cases involved people who had been swimming for some time but became
victims when an electrical charge was initiated. The simple flicking of a switch can instantaneously turn the water from safe to deadly.

Anywhere an electrical outlet is near water, ESD is possible. Most often, this occurs near docks and marinas. Usually, a cable is connected from the dock to a moored boat. If a piece of equipment has an AC ground fault, a dangerous electrical charge can enter the water.

Be careful in marinas!

Most ESDs have taken place in fresh water. It’s believed that the increased conductivity of salt water would prevent this from happening; however, there can be an exception. If the saltwater swimming area is close to a freshwater outlet, such as a stream or river,  problems can occur. Significant runoff from a heavy rain event can produce a layer of fresh water on top of the salt water (fresh water is less dense). This freshwater layer can be several feet deep and could support an ESD situation.

In ESD cases, it is typically impossible for someone to come to your rescue because they would also succumb to the electrical force. The only solution is to disconnect the source
of electricity and then save the victim. To be completely safe from ESD, never swim around marinas, docks or anywhere electrical outlets are near the water.

What can you do?

Boat owners should have their boat inspected by a qualified electrician to make sure the electrical system will not leak current into the water. Marina owners and managers should be encouraged to install ground-fault circuit interrupters (GFCIs) on all shore power pedestals and marina wiring circuits. Prohibiting swimming near marinas and docks should also be enforced. There are devices on the market which can detect electrical current in the water. If none is present, there is a “Green Light for Swimming.”

However, as mentioned above, the water can become deadly in a fraction of a second when before it was deemed safe. Regulation on electrical apparatus on docks and marinas is coming, though slowly.

For both SWB and ESD, it’s impossible to know how many cases have actually occurred. Unless someone witnesses the event, any fatalities will likely be attributed to more common causes of drowning (cramps, intoxication, etc.).

Experts assume that SWB and ESD claim many more victims than officially noted. For both SWB and ESD, the key is education. Swimmers should be aware of both situations and how to avoid them.

shallowwaterblackoutprevention.org
electricshockdrowning.org

By Ed Brotak, Southern Boating May 2019

Whirlpools and Maelstroms

Whirlpools and Maelstroms

The myths and realities of whirlpools and maelstroms

Violent maelstroms capable of pulling large ships under with all on board lost have been described in literature written by the likes of Edgar Allen Poe, Jules Verne and Gore Verbinski, who directed Pirates of the Caribbean.

But do such monstrous whirlpools really exist?

Well, yes and no.

In previous articles, I’ve discussed vortices in the ocean from huge gyres that cover an entire ocean basin to smaller, but still significant, eddies that break off from major ocean
currents and are hundreds of miles across. Just like the atmosphere has smaller vortices such as tornadoes and waterspouts, so do bodies of water. Wherever water is moving,
you will see vortices. Some are very small, only inches or a few feet across, and dissipate quickly. But larger ones can persist for some time and have significant water flows involved.

A whirlpool is a spinning, circular mass of water. Besides moving either clockwise or counterclockwise, the water flow tends to move inward toward the center of circulation.
Objects within the circulation are pulled toward the center of the whirlpool where there is often a depression in the water level. For stronger vortices, this can extend downward some distance below the water surface and is capable of pulling objects under water. The largest and strongest whirlpools are called maelstroms, derived from the early modern Dutch words maalen (whirl) and stroom (stream).

How do they form?

Whirlpools can form when two currents of water moving from different directions meet. At times, whirlpools can form along the edges of a single, straight flow simply due to fluid dynamics. With the strongest flow being in the middle of the channel, whirlpools can form along the edges due to frictional effects. They can also form from a single current that encounters an obstacle to the flow. Shallow whirlpools form when the obstruction is near or at the surface. Underwater features can produce larger and more dynamic whirlpools.

Underwater topography is a major factor in many of the world’s largest whirlpools. Even rip currents can occasionally form whirlpools just offshore. Whirlpools are often caused by tidal flows. These flows can become quite strong during the peak of tidal reversals.
Riptides are strong currents formed when rising or falling tidal flows are constricted typically by jetties, sea walls or the natural topography of an inlet, and strong whirlpools
can develop. On a larger scale, tidal flow constricted by topography has produced the world’s strongest maelstroms.

Whirpools of the World

Around the world, there are a number of extremely strong whirlpools or maelstroms that have gained recognition. Off the northwest coast of Norway, between the islands of Moskenesy and Mosken in the Lofoten Islands, is a particularly dangerous stretch of water where tides produce a strong whirlpool that was christened the Maelström many years ago. This was the whirlpool that Poe, Verne and Melville referred to and is probably the first maelstrom written about with references dating back to 1550.

The title “strongest maelstrom in the world” goes to the Maelstrom of Saltstraumen,  which is also off the north coast of Norway. The strongest tidal current in the world,
measured at 25 mph, occurs here. Even larger ships have to wait until the tidal surges abate before they traverse this dangerous passage. The largest whirlpool in the western hemisphere is called the Old Sow and is found in Passamaquoddy Bay between Maine and New Brunswick, Canada. A tremendous tidal flow between Passamaquoddy Bay and the Bay of Fundy is funneled through the Western Passage at great speeds. The underwater topography creates a huge whirlpool off the southwest coast of Deer Island.

The Old Sow Maelstrom

The Old Sow has a diameter of 250 feet, a vertical drop of 12 feet into its center and produces swells up to 20 feet high. Its name was derived from the “sucking” noise generated by the eddy, which apparently reminded some of a sough, a type of underground drain in the mining industry. Over time, its spelling was changed to sow because of the numerous “piglets” or smaller whirlpools surrounding it.

These maelstroms and some others are so famous that they have become tourist attractions. Visitors can board a boat and view these natural wonders from a safe distance. On a more transient basis, maelstrom-size whirlpools often occur with significant tsunamis. The disastrous tsunami that occurred in Japan after an 8.9-magnitude earthquake in March 2011 produced an enormous whirlpool in a harbor off the east coast of that country. Similar occurrences have been documented with other major tsunami events. The rapid flow of water interacting with the ocean bottom is the likely cause.

Danger, Stranger

How dangerous are whirlpools and maelstroms? They are certainly not as potent as described in the literature works by the authors mentioned above and they can’t suck large ships down under the sea, but even large ships try to avoid the stronger maelstroms when the tidal flows produce the worst turbulence. Certainly, smaller boats are more affected; loss of control is possible, grounding and capsizing can happen, and anyone in the water is certainly at risk. Drownings have occurred.

The best thing to do is to avoid whirlpools. Nautical charts have a specific symbol for eddies (a small swirl), and you’ll see them in areas where they are common. You can mark these on your navigation chart or even set up a warning alarm on your GPS if you get close. If your boat is trapped in a whirlpool, maneuver to the outer edge of the vortex in the flow’s direction and thrust your way out.

By Ed Brotak, Southern Boating April 2019

What’s a Wave?

Every boater needs to know the surface condition of the water they are traversing. This condition is referred to as the “seas” and is the result of both waves and swells.

But what’s really going on here and what’s a wave?

What’s a wave? Time for some physics. A wave is a packet of energy that moves away from its source. Waves of energy are emitted from the sun, move through the vacuum of space, reach the earth, and heat it. If these waves of energy are moving through some substance, a disturbance is created. Waves on the ocean are packets of energy moving along and give the illusion that the water itself is moving. In reality,  it’s the wave energy that moves and causes the water level to progressively rise and fall as the wave passes, but the water actually moves in a circle with little forward motion.

The most common cause of typical surface waves is the wind. Friction between the water surface and the air just above it allows some of the wind energy to transfer down into the water. Although we typically only see the wave on the surface, the disturbance and water movement extend downward generally to half of the wave’s wavelength.

Geological Disturbances

In previous articles, I’ve discussed storm surges with hurricanes, tsunamis due to geological influences, and meteotsunamis associated with atmospheric pressure changes. In these cases, the sea level is actually elevated locally when the disturbance reaches the coast. When an oceanic wave approaches the coast, its structure changes. The bottom of the wave begins to slow due to frictional effects with the increasingly shallow ocean floor.

As the lower part of the wave slows, water converges, and compression forces water upward, building the height of the wave. With the top of the wave outracing the bottom, eventually, the wave becomes unstable and breaks toward the shoreline. The most significant aspect of a wave is its height, the distance from the trough to the crest. A wave’s size depends on wind speed, wind duration and the area over which the wind is blowing (the fetch). This will determine the total amount of energy transferred to the water.

Large waves are only produced when all three factors combine: strong winds, long duration and a long fetch over open water. Even under similar conditions, waves of varying heights are generated due to wave interactions. In standard descriptions of current or forecast conditions, the term “significant wave height” is used. By definition, this is the average height of the highest third of the waves. In my article on rogue waves, I noted, and official forecasts warn, that individual waves can be twice the size of the significant wave height.

Cascading Effects

Under extreme conditions, even larger waves can occur. There are other aspects of waves to note. The wave length is the distance between successive wave crests. The wave period, usually given in seconds, is the time it takes for successive waves to reach the same point. Swell waves, or just swell, refers to waves originally produced by wind that are now out of the generating wind field. They are more consistent and have a longer period than wind waves. These self-maintaining waves can propagate across the ocean for many miles and can move in directions that differ from the current wind field.

Reports on ocean conditions often include the swell direction, the direction from which the swells are coming. Don’t underestimate swell waves. In early March 2018, a powerful winter storm developed off the New England coast. Hurricane-force winds generated 40-foot seas over the North Atlantic. Swells generated by the storm propagated southward toward the Greater Antilles, more than 1,500 miles to the south. Buoys off the north coast of Puerto Rico recorded swell wave heights of 15-20 feet, record or near-record wave heights for March. Wave heights increased to as much as 30 feet and impacted the north coasts of Puerto Rico and the U.S.V.I. Widespread coastal flooding and beach erosion occurred.

A History of Waves

An interesting combination of wind speed and sea condition is the Beaufort Scale, named for Sir Francis Beaufort, an admiral in the British Navy. His original scale from 1805 related wind speed to sea condition and the ability to predict wind speed from sea condition and vice versa. For example, calm winds were associated with a “smooth and mirror-like” sea surface. On the other extreme, hurricane-force winds of 64 knots or greater were associated with “waves over 45 feet, a completely white sea due to spray and greatly reduced visibility.”

Current sea conditions are always available through the National Weather Service (NWS). You can also check out the National Data Buoy Center. Some buoys report wave height, wave period and wave direction. The NWS also provides marine forecasts that include sea conditions out to five days. There are numerical models that also utilize forecast weather conditions to predict wave heights. The Nearshore Marine Forecast or Coastal Waters Forecast covers a specific given area from the coastline out to 20 nm.

This is followed by an Offshore Marine Forecast or Offshore Waters Forecast that goes out from 20 to 60 nm, and finally the High Seas Forecasts for farther reaches. These forecasts will include wind wave and/or swell, or a combined seas or seas wave height along with the wave period for the near shore.

By Ed Brotak, Southern Boating February 2019

What is stony coral tissue loss disease?

What is stony coral tissue loss disease?

And more important, how do we stop it?

In September 2014, researchers noticed that certain stony corals along the Florida Reef Tract weren’t doing so well. The Florida Reef Tract stretches approximately 360 miles in an arc along the Florida Keys and southeastern Florida. It’s currently the world’s third largest reef.

In Miami-Dade County, of Virginia Key, corals were showing “small circular or irregular patches of white, exposed skeleton devoid of tissue,” explains Dr. Andy Bruckner, research coordinator for Florida Keys National Marine Sanctuary. From there, the tissue would slough off, leaving the stark white skeleton exposed until algae colonized it. The disease, he explains, “radiates across the colony and outward.”

Click the image to watch the sad progression of stony coral tissue disease along Florida’s East Coast.


And spread outward it did—the stony coral tissue loss disease has since been found in the Lower Florida Keys.

This spells trouble for the reefs, and for the creatures and people who depend on them. The reefs of the Florida Keys provide food and recreational opportunities for residents and vacationers alike, and they can protect coastal communities since they serve as a buffer for hurricanes and other storms.

Worldwide, coral reefs support approximately 25 percent of all known marine species. Reefs provide homes for more than 4,000 species of fish, 700 species of coral, and thousands of other plants and animals.

The architects of coral reefs are hard corals. Unlike soft corals, hard corals have stony skeletons made out of limestone that are produced by coral polyps. When polyps die, their skeletons are left behind and used as foundations for new polyps. An actual coral branch or mound is composed of layer upon layer of skeletons covered by a thin layer of living polyps.

Scientists believe the disease is likely caused by a bacterial infection carried by currents, but little else is known.

As Joanna Walczak, southeast regional administrator at the Florida Department of Environmental Protection puts it, “this is an all hands on deck situation, requiring an unprecedented effort and response.”

Partners from universities, nonprofits, and government agencies have joined the Florida Keys National Marine Sanctuary and the Florida Department of Environmental Protection to understand the disease and how it can be stopped.

What can we do?

To stop the spread of contamination from one dive site to another, experts have a few recommendations for divers/snorkelers and swimmers.

Dos

  • Inspect dive gear equipment and remove any debris between each dive
  • ALWAYS Sanitize non-sensitive gear with a bleach solution
  • For sensitive gear, wash with copious amounts of fresh water
  • Move from “healthiest” site to “dirtiest” site
  • Always decontaminate regulators, gauges and computers
  • Use a reef-healthy sunscreen

Don’ts

  • Never leave any debris on dive/snorkel gear
  • Don’t move from a diseased site to a healthy site
  • Don’t dispose of disinfectant or waste into the ocean or a storm drain

“This collaborative response effort is vitally important,” says Sarah Fangman, Florida Keys National Marine Sanctuary superintendent. “The broad knowledge provided by all our partners working together has resulted in the development of a variety of interventions.” Together, these partners hope to develop an effective treatment.

Learn more what scientists are doing to learn about stony coral tissue loss.

–Erin

Types of Fog

Types of Fog

Did you know that there are many different types of fog?

Fog can certainly spoil an otherwise perfect day on the water but even more important, it can be dangerous. Fog reduces your visibility, sometimes to near zero. Navigating without visual clues is difficult at best, and collisions with other vessels become a real possibility. If you’re close to shore, running aground is a risk.

Fog is defined as a cloud that touches the earth’s surface. If you’ve flown on an airplane through a cloud, it looks like fog outside your window. What you’re looking at are condensed water droplets—ice crystals if it’s very cold. The moisture that’s always present in the air (water vapor) has condensed, typically on microscopic particles in the air, but the droplets are so small and light that they are supported by air currents and do not fall to the ground.

The air can only “hold” so much water vapor (the gaseous form). The dew point number you often hear meteorologists refer to represents this and is the temperature air must cool to produce saturation (when the relative humidity is 100 percent). Cooler air can’t hold as much water vapor, so when cooled further, condensation (the liquid form) forms and produces some type of fog or cloud. You can also get the same effect by adding moisture to the air, which effectively increases the air’s dew point and relative humidity. Fog can form in a variety of situations and has different names depending on the circumstances.

Sea fog

One of the types of fog boaters must often deal with sea fog, which occurs when relatively warmer air passes over a cooler water surface. The air is cooled from below and if the dew point is reached, fog forms. San Francisco is a great example of this because of the cold current off shore.

In the southeast U.S., winter and early spring are prime times for sea fog to form over coastal waters. The shallow waters near the coast are cooled by the occasional cold outbreaks from the north. The deeper waters of the central Gulf and of the Gulf Stream in the Atlantic remain warm. The air above them is very warm and moist. If the wind direction is such to move this air toward the coast (south or west in the Gulf, east in the Atlantic), it is a perfect situation for sea fog to form. However, if the wind is too strong (above 10 mph), mixing would dissipate any fog. If not, the fog can continue until the wind changes direction.

Steam fog

Sometimes in the winter, when extremely cold air moves over relatively warmer water, steam fog (aka sea smoke) forms. Water vapor evaporating from the water surface quickly condenses into streamers of fog in the cold air. Steam fog typically isn’t as deep or persistent as sea fog.

Frontal fog

Also in the winter, fog can develop with fronts, particularly warm fronts. This “frontal fog” occurs north of the surface warm front in the cold air. Frontal fog is widespread (it can cover hundreds of miles) and can occur over land or water. It will not “burn off” during the day and only moves out when the front itself moves.

Ground fog

Usually not a problem for boaters, ground fog can be an annoyance for those living or visiting the coastal areas. Ground fog forms over land at night. On clear, calm nights, the ground surface radiates heat out into space and quickly cools. The ground cools the lowest layer of air from below, cools the air to its dew point, and fog is formed. This type of fog typically “burns off” later in the morning as the sun warms the ground. Also keep in mind that whenever there is precipitation, some fog will form. Additional moisture and cooling from falling rain or snow can make the air saturated. The fog and the precipitation itself can limit visibility.

Fog advisory

It is always prudent to check the latest marine weather forecast before heading out in your boat. A “Dense Fog Advisory” means you may run into areas of fog that can reduce visibility to one nautical mile or less. As for equipment, make sure you have a way to check the latest weather conditions and forecast. For navigation, GPS or nautical
charts can help determine your exact location and course when visible cues aren’t distinguishable. A compass will help you plot a heading. Shipboard radar is certainly useful in seeing other vessels, but keep in mind that even weather radar can’t detect fog. Make sure your navigation/running lights are working. They must be turned on when visibility is restricted by fog.

In addition, all vessels must be equipped with sound-making devices or equipment. For vessels larger than 39.4 feet (12 meters), this must be a sound signaling appliance capable of producing an efficient sound signal that’s audible for a mile with a 4- to 6-second duration. Smaller boats can use whistles or horns. Once you’re on the water, keep track of the weather because fog can form quickly over water. Also, a change in wind direction can bring an existing fog bank into your path.

If you encounter fog, don’t panic. Just follow some basic rules. First, slow down. Turn on your running lights even if it’s daytime. Start making sounds with the appropriate equipment. Listen for sounds from other boats. If your boat is equipped with radar, check it often for other vessels or obstacles. Use passengers as lookouts, particularly at the bow, especially on larger boats.

Underwater hazards like sandbars or reefs also pose a risk, more so if you’re running close to the shore. Determine your location and heading. If you are lost, stop and drop anchor, but continue to produce clearly audible sounds. In time, the fog should lift or move out.

By Ed Brotak, Southern Boating February 2019

El Niño and La Niña

What’s the difference between El Niño and La Niña?

Long before meteorologists “discovered” the El Niño (EN) phenomenon, fishermen in Chile and Peru were well aware of it. Typically, the fishing there was great. The deep, nutrient-rich waters attract bountiful marine life, but every few winters, things would change dramatically. It got much warmer, it would rain in the coastal desert region and the fish would leave. A flood of warm water from the west would push the bountiful cold water to the south. Since this was often most pronounced around Christmas, they called it El Niño for “the boy.” La Niña (LN) is the female equivalent.

The Boy and the Girl

The El Niño and its counterpart, La Niña, have major impacts on the weather around the world, but did you know they are actually oceanic circulations? To explain the EN/ LN cycle, one must go to the tropical Pacific Ocean. With the cold Humboldt Current and associated upwelling, the eastern Pacific waters off of South America are abnormally cold, over 10ºF colder than sea surface temperatures in the western Pacific. In the tropics, the prevailing (or trade) winds tend to blow from east to west and drive the ocean surface waters with them. The North Equatorial Current flows westward from the South American coast across the Pacific to Oceania in the Asia-Pacific region.

There are times when the trade winds weaken and, consequently, so does the equatorial current. Warm water, which used to be transported across the Pacific, now begins to “back up.” Water temperatures then begin to abnormally rise in the central Pacific and work its way back to the South American coast. This warming can amount to a two- to six-degree increase over normal conditions, a significant departure for this vast amount of water. This is the El Niño.

With La Niña, the trade winds and equatorial current are abnormally strong. Larger than normal amounts of warm water is transported away from the central and eastern Pacific, and water temperatures there become unusually cool. Both El Niño and La Niña events tend to develop in the spring, hit their peak intensity in the winter, then weaken the following spring, about a 9- to 12-month average lifespan.

Cycle(s) of life

Meteorologists often refer to the EN/LN cycle as the El Niño Southern Oscillation (ENSO). The Southern Oscillation deals with the atmospheric pressure changes in the Pacific region that accompany the two phases. In addition to the two extremes, we can have more average conditions (called ENSO neutral).

So, how and why does the EN/LN cycle affect our weather? The tropical oceans are a vast storehouse of heat or energy. They transfer some of this energy to the air which goes high into the atmosphere and “feeds” powerful jet streams. Changes in the tropics can reach well into the mid and high latitudes.

The effects of the EL/LN cycle are most pronounced in winter. The warmth of El Niño fuels a strong, southern jet stream that starts in the eastern Pacific and produces an active southern storm track that blocks cold air from entering much of the U.S. Thus, we can expect northern tier states to be warm and relatively dry, the south having normal to cool temperatures and wet from southern California to the East Coast. In a La Niña event, the energy is concentrated in the western Pacific basin.

In this Hemisphere

For North America, La Niña brings a more variable northern jet stream and a northern storm track with occasional cold outbreaks. La Niña tends to bring warm and dry conditions to the south with cooler and wetter conditions to the north. Although the EN/LN cycle is less of a weather controller in summer, there is one important effect—El Niño summers tend to have fewer Atlantic hurricanes due to wind shear because of relatively strong westerly winds aloft in the tropics. Conversely, La Niña years see less wind shear and increased tropical cyclone activity.

You would think that because of its influence and possible major impact on winter weather, the EN/LN cycle would be a great forecasting tool for meteorologists. Yes, it’s often the basis of winter forecasts, but it’s not so simple. By closely monitoring ocean temperatures in the central and eastern Pacific, meteorologists can typically tell when one phase or the other is beginning, and because it takes months to achieve maximum strength, they can give advanced warning, but the EN/LN cycle is not a regular occurrence.

An El Niño event is not necessarily followed the next year by a La Niña. The return period on the cycle varies from two to seven years, and the strength of the actual event varies considerably. There are also other weather influences that can override the El Niño or La Niña effects, and these other factors can’t be forecasted months in advance.

Current State

The winter of 2015-16 saw the strongest El Niño on record and was the first El Niño since 2009-10. This was followed by weak La Niñas the next two winters. In 2018, fall saw tropical Pacific Ocean temperatures running above normal, and it appeared that an El Niño was developing, but it’s a weak one. The official winter forecast (Dec-Feb) reflects this with only the southeastern part of the country predicted to have near normal temperatures and the rest a bit warmer. Wet conditions are forecasted for the southern tier states, while the north is expected to be normal to dry.

You may wonder what causes the EN/LN cycle. Well, we don’t know. Does climate change affect the cycle? Probably, but it’s hard to prove. It’s speculated that the EN/LN cycle has been going on for thousands of years and, most likely, will continue for many thousands more.

By Ed Brotak, Southern Boating January 2019

Deepwater Horizon: Eight Years Later

Has the Gulf of Mexico recovered from the Deepwater Horizon disaster?

The Deepwater Horizon oil rig, located 42 miles off the Louisiana coast, exploded on April 20, 2010. The initial explosion and subsequent fire killed 11 people. The badly damaged oil well dumped oil and gas into the Gulf of Mexico and did so for 87 days until it was successfully capped. By that time, an estimated 210 million gallons of oil had poured into the Gulf, the worst oil spill in U.S. history.

Some of the oil was at the surface and clearly visible. A variety of government agencies, as well as workers from the owners of the rig (BP and Transocean), tried to contain the spreading oil slick with floating booms. A chemical dispersant was spread to dissolve the oil. Still, over 1,000 miles of coastline from Texas to Florida were affected. The ecological impacts from the surface oil were devastating and the images of dead marine life and seabirds covered with oil remain etched in our memories.

But these were only the visible effects. The damaged wellhead was located 5,000 feet below the water surface. There wasn’t just oil at the surface but all the way down to the seafloor. The oil spill had significant impacts on aquatic life, but it has only been through scientific analysis that the extent of the effects has become known. Much of the research has been funded by BP, which is part of their settlement for the damages produced.

Lasting Consequences of Deepwater Horizon

One study on fish populations used an ecosystem model verified by actual measurements. A 25 to 50 percent decrease in reef fish was noted in areas closest to the spill. Demersal fish (bottom dwellers) were decreased even more by 40 to 70 percent. Predator populations also decreased with fewer prey species. With juvenile fish being affected more, a whole generation may have been lost, and effects may continue with some slower-growing populations taking 30-plus years to fully recover.

A NOAA study concluded that oil contamination can cause cardiac deformities in commercially important species, such as bluefin and yellowfin tuna and mahi-mahi, and this can lead to premature death. Another study on fish shows that species nearest the oil spill were hardest hit with red snapper and southern hake showing the greatest declines. The study showed that oil contamination of fish continues to decline, but no areas studied are free from oil; however, fish populations seem to be recovering.

Workers removed tons of contaminated soil and sludge from the shoreline.

One NOAA study centered on bottlenose dolphins living in Louisiana’s Barataria Bay. Besides “historically high” death rates, reproductive failure rates reached 80 percent and were directly related to exposure to oil in this area, one of the hardest hit. Bottlenose dolphins in nearby areas of Louisiana and Texas also showed higher death rates.

Overall, in a 2017 NOAA assessment, it was estimated that tens of thousands of birds were killed, perhaps over 100,000 sea turtles died, billions of harvestable oysters were lost, and trillions of newly hatched fish were killed. Of great concern was the effect of the oil spill on the seafloor and the “deep sea” or benthic zone, the layer of very cold water extending down to the seabed. It is a zone of little light and extremely high pressure, but aquatic life does exist there. It is also a region that is extremely difficult to observe, so not much is known about it.

Biodiversity Blight

One study showed that there was a large loss of diversity of soft-bottom infauna (creatures living in the sediment). Another research project in 2014 indicated that some species of microbes in the sediment were eliminated. Microbes are important because they recycle nutrients and are at the base of the food chain. Colonial octocorals were covered with a flocculent material and died. The flocculent material consisted of particles, such as bacteria or phytoplankton, to which oil molecules had attached and then fell to the ocean floor as “marine snow.” Bottom effects were noted up to nine miles from the wellhead site.

A conservationist attempts to clean oil from a young sea turtle

Today, over eight years later, there are some encouraging signs. One study indicated that naturally occurring marine microbes and bacteria were breaking down or biodegrading the oil. Various species of fish are making a comeback. Even where die-offs were most pronounced, fish populations have been replenished by migration from unaffected parts of the Gulf. Other studies have shown that smaller, short-lived species with high reproductive rates seem to be rebounding well. But it is still too early to tell the long-term effects on larger species, such as turtles, whales, and dolphins. Longer life spans mean slower reproductive rates, which may be impacted.

Exxon Valdez

Prior to the Deepwater Horizon incident, the benchmark for U.S. coastal waters oil spills was the Exxon Valdez disaster in Alaska in 1989. After running aground and splitting its hull, the tanker discharged nearly 11 million gallons (262,000 barrels) of oil into the pristine waters of Prince William Sound. The oil-covered shorelines and coastal waters were deadly to sea otters, harbor seals and, especially, seabirds (hundreds of thousands died). Fish populations also declined with the loss of salmon and herring eggs estimated in the billions. Many species of fish and birds took a decade to recover, while others took two decades. The herring population still hasn’t recovered.

Although there are some similarities, there are also many differences between the Exxon Valdez spill and the Deepwater Horizon disaster. More than 10 times the amount of oil entered the Gulf. It wasn’t just at the surface; it extended throughout the water column to the seafloor. And the oil itself was different in terms of its composition and toxicity. One similarity is that it is difficult to actually ascertain the effects of these events. To a large extent, preexisting conditions weren’t known in terms of marine life populations and natural fluctuations.

Another problem in determining the long-term effects of a single event is that there are many other negative factors affecting marine life today. In the Gulf (and elsewhere), overfishing has depleted fish populations. Pollution, especially from agricultural area runoff, has produced the “Dead Zone” in the northern Gulf and likely affected other areas. The highly toxic “Red Tide” has both natural and man-made components. Furthermore, ever increasing water temperatures due to climate change have obvious impacts on all sea creatures.

For years, marine biologists have marveled at the resiliency of the Gulf of Mexico, but with multiple negative events, that resiliency is in question.

By Ed Brotak, Southern Boating December 2018

Red Tide Updates

Red Tide is a menace with no simple solution

The infamous red tide algae on Florida’s southwest coast has died or moved offshore, so beaches are open to visitors again.

Data gathered during the 2018 event is showing why those blooms originate offshore, when they form and their routes to the shoreline. Researchers dispatched and steered a robotic minisubmarine with sensors that picked up the red tide scent way offshore and then tracked it to the coast. Computer simulations with the new data showed that the spring or summer timing of ocean currents make a big difference.

Typically, offshore loop currents and eddies push up against the West Florida continental shelf in the spring. This causes an upwelling which moves nutrients to the surface. In most years, the red tide algae (Karenia brevis) remains offshore on the bottom and, without a supply of nutrients, remains quiescent.

In 2018, however, Gulf loop currents pushed up against the shelf later than usual, in mid-July, but by then K. brevis cells were already gorging on nutrients and blooming. Ocean
currents and winds then brought the algae to the shoreline. A team led by Dr. Robert Weisberg at the College of Marine Science at the University of South Florida in St. Petersburg has published the findings in the Journal of Geophysical Research.

But below the surface, marine life took a big hit. Snook and redfish, two nearshore gamefishes, are of major concern. Recently, new initiatives were announced to help the cause.

One is Adopt a Snook, a collaboration of Coastal Conservation Association-Florida,
Mote Marine and the Florida Fish and Wildlife Conservation Commission (FWC).
The plan is to raise and release 10,000 juvenile snook into brackish tidal creeks in
2019 and 2020.

To protect stocks and to maximize future spawning success, FWC has extended the
catch-and-release calendar for snook and redfish from Pasco County south to Gordon
Pass near Naples. Until May 11th, anglers in that zone must release all snook and
redfish. After May 11th, redfish regulations return to normal and anglers may keep one
redfish between 18 and 27 inches. The regular fall snook season starts September 1st.
Anglers may keep one snook between 28 and 33 inches until the end of November.

Another initiative directly tackles water quality to benefit all marine life. Sarasota
Bay Watch (SBW) is more than doubling down on planting native clams to help filter out
unwanted nutrients that make algae blooms worse. In 2017 and 2018, SBW volunteers
planted close to 250,000 native clams in Sarasota Bay. Those clams survived the 2018
red tide bloom, giving the nonprofit a green light to proceed with a new, long-term
plan to raise funds, enlist volunteers and plant another one million clams to filter out
unwanted nutrients.

What Happened?

So far, a million pounds of decaying marine life have been disposed of, including hundreds of sea turtles, dozens of dolphins, over 100 manatees, and even a whale shark. A noticeable stench was often present, and many beach-goers fell victim to respiratory stress including breathing difficulties and coughing. And we have red tide to blame for it.

Sludgy blue-green algae invades the shores of Martin County.

What is it?

What exactly is red tide? It’s one-celled algae called Karenia brevis commonly found in the Gulf, and typical blooms (rapid increases in numbers) cause little problem. In high concentrations, however, the algae turn the water a reddish-brown color (hence the name). But because this event has nothing to do with tides, scientists prefer to call it a harmful algal bloom (HAB). Similar situations occur in other areas around the world with a variety of algal species. But this particular HAB is especially noted along the Gulf shores of Florida and Texas and can be extremely harmful.

K. brevis emits a toxin called brevetoxin, and excessive blooms can fill coastal waters with it. Shellfish are immune, but they accumulate the brevetoxin in their bodies, which makes them hazardous to eat. Other aquatic life succumb to the poisonous waters. For people, problems arise through skin irritation and rashes after swimming in it or when, according to Kristie Anders, education director of the Sanibel-Captiva Conservation Foundation, “Crashing waves turn the toxin into an aerosol which people breathe in.” Those already with chronic respiratory issues are at particular risk. There may even be long-term health effects.

To put numbers on the problem, background concentrations of K. brevis are 1,000 cells per liter of water or less. At concentrations of 5,000, shellfish, if eaten, can cause illness, and harvesting beds are closed. Fish kills and human respiratory problems can start when concentrations of this algae reach 10,000 (still classified as “Low”). This year, levels surpassed one million (“High”) at the coastline. Concentrations some distance offshore are even worse with readings in the tens of millions.

What do the experts say?

Marc Suddleson, program manager of NOAA’s National Centers for Coastal Ocean Science Monitoring and Event Response for Harmful Algal Blooms Research Program, says that the red tide algal blooms typically start in late July, often 10 to 40 miles off the coast. K. brevis can actually move, primarily with the wind and currents. Patches of the algal bloom then drift toward the shoreline where concentrations increase due to the shallower water’s lower salinity and increased nutrient levels, notes Dr. Robert Weisberg, professor and director of the University of South Florida’s Ocean Circulation Group. Occasionally, the blooms “explode,” and that’s when problems occur.

The current event actually began in October 2017. Anders points out that rainfall from Hurricane Irma in September caused nutrient-rich runoff water to flow into the estuaries and mix with offshore waters enough to stimulate a K. brevis bloom. This moved ashore and intensified and by the end of the year, dead fish were reported in Charlotte, Lee and Sarasota counties. Later in the winter, cooler water temperatures blunted the bloom, but with the warmer temperatures of summer, it came back with a vengeance.

The major questions are: What causes the explosive K. brevis blooms, and what can we do to stop them? It is widely believed that the culprit is nutrient pollution from inland agricultural runoff. There is a major push to do something about this.

What does it mean for today?

From anecdotal evidence, we know that red tide events that produce fish kills have been occurring in the Gulf for hundreds of years, even as far back as the 1700s. With limited data, we have no way to compare those events to today. In any case, Suddleson claims that red tide events now seem to start earlier, last longer, occur more frequently, and are more intense. He also adds that nutrient pollution may be a contributing factor but is not a significant factor. In fact, a long-term research project sponsored by NOAA concluded in 2014 that there is no direct link between nutrient pollution and the initiation of red tide.

So, what is the cause?

Algae are very simple, mainly aquatic plants that need sunlight, nutrients in the water and a proper water temperature and salinity, all of which vary with species. Variance in any of these factors can affect algal growth. Clouds of dust which have traveled across the Atlantic from the Sahara Desert can block some light.

Also, if one species of algae blooms earlier, it can block the sunlight from other, slower developing species. Nutrients in the water come from a variety of sources. Anders points out that large phosphate deposits and mines have existed for years in the area around the Peace River, which empties into Charlotte Harbor located north of Ft. Myers, Florida. She also notes that in this rapidly developing region, there are many sources of nutrient pollution, including lawn fertilizers.

Dr. Weisberg has his own theory on red tide events. He believes the Loop Current, which dominates the circulation of the Gulf, varies in exact location. At times, the circulation produces strong upwelling off Florida’s west coast. If this happens in the spring or summer, these nutrient-rich bottom waters feed other types of algae which can then suppress K. brevis. Red tide events occur when K. brevis outcompetes other algae. Using past data on Loop Current position and red tide events, Dr. Weisberg noted a near perfect correlation, and the model is used to predict future outbreaks. Once an event is ongoing, Weisberg’s group sends out forecasts of movement going out for several days

How will we know what’s going on?

In terms of the water itself, one lab-based study showed that the K. brevis algae had an increased growth rate when both the water temperature and carbon dioxide level in the water increased. We know that both of these are occurring. However, Suddleson points out that there is a limit to this and if water temperatures continue to increase, K. brevis may not fare well.

Red tide is monitored closely. NOAA uses satellite observations to detect K. brevis blooms while they are still far offshore. Water samples along the coast are analyzed for the algae’s presence. When an event has developed, NOAA will issue forecasts twice weekly which include actual conditions and expected impacts. The Florida Fish and Wildlife Conservation Commission sends out a weekly Red Tide Status update which includes a forecast done in conjunction with USF.

Although scientists may disagree about the impact of agricultural runoff for red tide but can agree that red tide causes additional problems. Blue-green algae outbreaks and red tide should be controlled. Red tide is an extremely complex problem still being studied for both its cause and the solution, neither of which offers simple answers.

By Ed Brotak, Southern Boating October 2018

How do we eradicate lionfish?

Is it possible to eradicate lionfish from our waters?

In the past couple of decades since lionfish really started taking over the reefs in Florida, The Bahamas, the Caribbean, and along the U.S. Eastern Seaboard, we’ve speared, hooked and cooked lionfish in the hundreds of thousands. But can we eradicate lionfish?

Unfortunately, we’re still a long way from controlling their spread, but a new front is opening in the war against the Indo-Pacific invaders: traps designed exclusively to harvest them.

Trap ’em

Commercial fishers in the Florida Keys have been very successful at catching lionfish in their lobster traps. During the eight-month-long, 2017-18 lobster harvest season, trappers hauled in nearly 100,000 pounds of the venomous-spined exotics, and they weren’t even trying. One fisherman accounted for 30,000 pounds of that total, mostly from depths of more than 100 feet. Lionfish diving derby catches were less than half that amount. Raking in a tidy $6.25 per pound, harvesters were barely able to keep up with the high demand from restaurants and grocery stores.

A diver spears one of many lionfish during a lionfish derby.

The bountiful lionfish bycatch gave the Florida Keys Commercial Fishermen’s Association an idea to test four trap designs. The group spent three years pushing reams of documents through a Byzantine gauntlet of state and federal bureaucracies. They also raised hundreds of thousands of dollars to finance the experiment with neither a yes or no from regulators. Finally, the Association threw in the towel last April. Association executive director, Capt. Bill Kelly, believes resource managers were stalling for fear of creating a new commercial trap fishery in waters where the gear had long been banned. But Kelly said all his group wanted to do was test “proof of concept.”

Not long afterward, NOAA Fisheries, which regulates commercial and recreational fishing in the U.S. and manages a network of marine sanctuaries, announced it was open for public comment on a similar, but scaled-back trapping permit request from the Florida Fish and Wildlife Conservation Commission (FWC). Kelly calls it “an absolute slap in the face” to his industry.

Spur Innovations

Early this year, the FWC awarded some $250,000 in grants to five organizations to test gear designed to harvest lionfish in waters too deep for safe recreational diving. The University of Florida plans to look at a “non-containment curtain trap.” Reef Environmental Education Foundation (REEF) wants to figure out whether recordings of “lionfish vocalizations” could be a tool for attracting the predators into a trap. American Marine Research Company plans to develop an underwater drone to harvest lionfish. R3 Digital Sciences is working on extension kits for existing commercial lobster traps, and Atlantic Lionshare Ltd. is developing a remotely-operated underwater vehicle to suck up lionfish from the depths.

Meanwhile, the FWC has stepped up its incentives for recreational and commercial divers by awarding thousands of dollars in cash and prizes in the Lionfish Challenge which ran through September 3rd. The agency will hold its second lionfish summit October 2-4 in Cocoa Beach, Florida, where divers, scientists, conservationists, and resource managers are invited to discuss the latest developments in lionfish control.

While both divers and trappers are the most effective soldiers in lionfish naval warfare, anglers have also joined the fray. Scientists from Nova Southeastern University near Fort Lauderdale regularly catch the enemy species on hook-and-line using live bait on deep wrecks. Since the International Game Fish Association opened lionfish to world record recognition in 2013, the all-tackle winner has changed hands three times. The current mark is Jesse Paul Moore’s 2-pound, 12-ounce fish he caught in August 2015 using sardine for bait off Madeira Beach on Florida’s West Coast.

Uphill Battle

No one really believes that lionfish can be eradicated from infested waters. With females capable of producing 50,000 eggs every three days that mature in a year, the species seems too well established to knock out completely. However, control efforts have succeeded in driving them off of some local reef systems, and those who care about the health of the marine ecosystem aren’t willing to give up the fight.

By Sue Cocking, Southern Boating October 2018

For more, check out our article on eating lionfish.

Our Rising Seas: Coastal Resilience

Rising seas are more than a threat. They’re a reality.

It’s been a little more than a year since I first wrote about rising sea level and the problems it is causing. In this time, a considerable amount of data has come out on rising seas.

Unfortunately, most of it is not good news. A recent study of the Antarctic ice sheet concluded that the ice loss rate—which has amounted to 3 trillion tons in the last 25 years—as tripled in the past 10 years, adding to the rise in sea level. Another group of researchers noted that if the glaciers that hold back ice sheets on top of Antarctica and Greenland were to collapse, this could lead to extremely rapid rising seas around the world.

In this scenario, it’s predicted locations like South Florida could see a sea level increase of 10 to 30 feet by 2100. Another study on global mean sea level using satellite altimetry shows not only is sea level rising, but the rate of rise is too. This means that actual sea levels by 2100 could be twice as high as currently predicted using the observed rate of increase.

Significant Shifts

In an article published in July, a group of scientists compared future climate forecasts with past climates of a similar temperature. A warming of 1.5˚C (well below the 2˚C goal of the Paris Climate Agreement) could bring about “significant shifts in climate zones and the spatial distribution of land and ocean ecosystems.” The scientists said, “The changes we see today are much faster than anything encountered in Earth’s history. We can expect that sea level rise could become unstoppable for millennia.”

In my previous article, I noted that there has been a significant increase in “fair weather” flooding or flooding that occurs with non storm-related high tides. Although seas are rising everywhere, the amount of increase is not consistent around the world. The southeast coast of the U.S. has been particularly hard hit. A slowing of the Gulf Steam which transports water away from the East Coast and changes in atmospheric circulations seem to be the causes. In Miami, fair weather flooding events now occur 20 times per year. Charleston had 50 such events in 2016.

In a study released by the National Oceanographic and Atmospheric Administration (NOAA) in February, it was noted that the rate of such flooding was also increasing particularly along the southeast Atlantic coasts. Scientists concluded: “With continued sea level rise, high tide flood frequencies will continue to rapidly increase.”

Their forecast is even more startling. By 2100, even with conservative estimates of sea level, “high tide flooding will occur every other day or more.” Furthermore, with a higher sea level, “high tide flooding will become daily flooding.”

Coastal Resilience

The question is, “If we’re already at this point, can anything be done to protect our vulnerable coastlines?”

In 2007, the Coastal Resilience program was initiated by The Nature Conservancy (TNC), NOAA, the Association of State Floodplain Managers, several universities and private companies, and various international organizations. “Coastal Resilience” is defined by NOAA as “building the ability of a community to bounce back after hazardous events, such as hurricanes, coastal storms, and flooding, rather than reacting to impacts.

A community that is more informed and prepared will have a greater opportunity to rebound quickly from weather and climate-related events, including adapting to sea level rise.” From TNC’s viewpoint, “Coastal Resilience is a program to examine nature’s role in reducing coastal flood risk. The program integrates community engagement with maps. It’s delivered through a network of practitioners around the world supporting hazard mitigation, climate adaptation, and conservation planning.”

The first step is to define the problem. There are two aspects which must be considered: the threat and the threatened area. Threats include coastal storms, hurricanes, tsunamis, and high tide flooding. All are aggravated by the continuous sea level rise. The area threatened varies depending on the situation and coastal features.

What can be done to minimize flooding?

Coastal areas include natural habitats and man-made structures and infrastructure. Both must be considered when determining the risk and the ability to lower that risk. Solutions can also incorporate both. Nature has its own way of protecting coastal areas. Sand dunes can block damaging waves and, to a certain extent, the water level rises. Coastal wetlands and forests can similarly protect inhabited areas that are somewhat inland. Natural protection systems have been called Green Infrastructure. Where they’ve been damaged or destroyed, they can be brought back. Existing natural areas need to be protected.

In terms of human development, regulations, land use planning, building codes, and flood preparedness are tools. Structural features, such as sea walls, groins and breakwaters can be built. Natural habitats can be protected and maintained. Man can even mimic nature with artificial reefs, etc.

According to NOAA, “Decision-makers in coastal communities around the country need actionable information to make informed choices. The National Ocean Service provides a suite of services and expertise to help communities identify risks and vulnerabilities to apply sustainable solutions that increase resilience to the impacts of climate change, extreme weather and coastal inundation. This is about ensuring that coastal citizens, planners, emergency managers, and other decision-makers have the reliable information they need when they need it.”

See for Yourself

To help planners fully understand the critical issue they are actually facing, the Coastal Resilience Mapping Portal was developed. This web tool includes past and future flood risk models, FEMA Flood Zones, wetlands area, and land cover. By clicking on a map, users can also see what projects are already in progress.

One NOAA tool that is particularly striking is the “Sea Level Rise Viewer”. For selected coastal areas, you can see the predicted results of various amounts of sea level rise. If this isn’t enough, they have included recognizable landmarks and show how water will engulf them. To help communities plan for the future, NOAA Coastal Resilience Grants are available. NOAA will also provide educational materials and even courses on the subject.

By Ed Brotak, Southern Boating August 2018

Exit mobile version