Markets Snapback! But Uncertain Economic Conditions Persist

Weekly Market Outlook
By Donn Goodman
May 01, 2023

Welcome back to our loyal readers and subscribers.  We appreciate that several of you reached out these past few weeks with your comments about our services and the kind things you shared about this weekly column, the Big View bullets, and Keith’s videos.  THANK YOU!

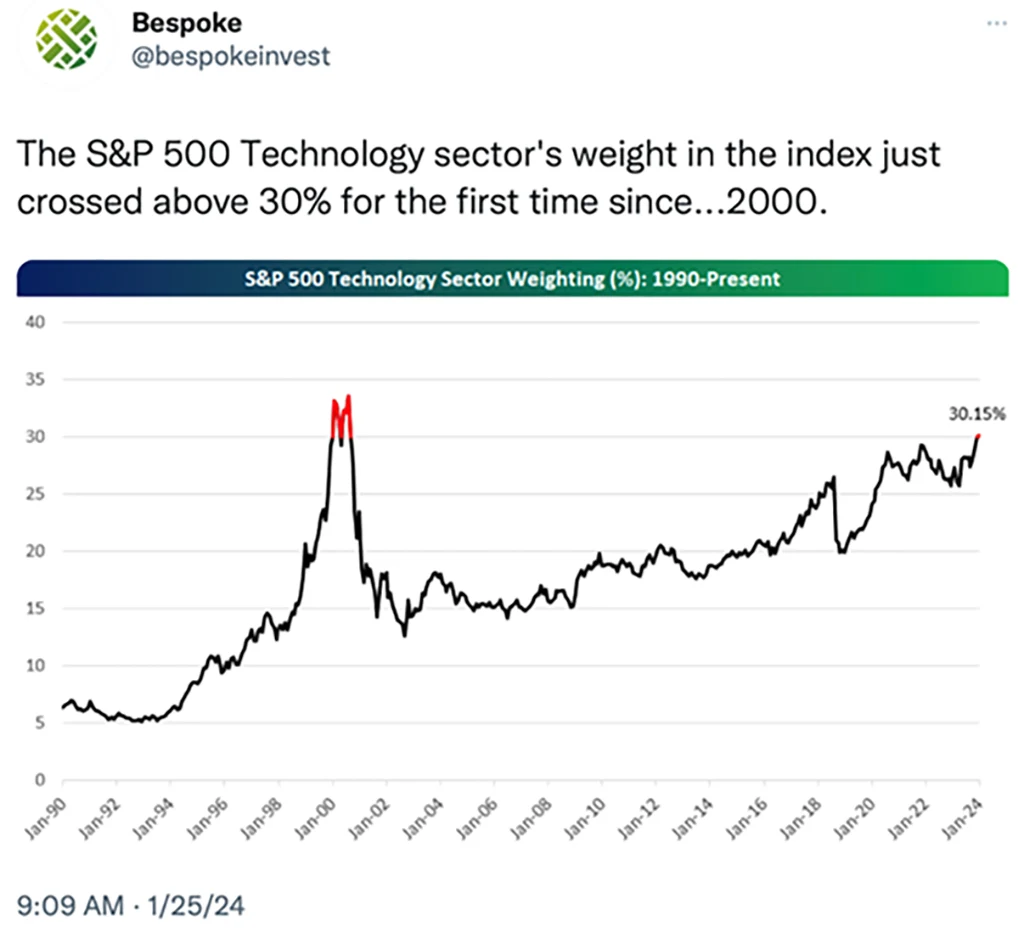
The stock market gyrated this past week, heavily influenced each day on another new (and negative) data point.  As you may be well aware, the markets have just gone through a mild two-week pullback, with the NASDAQ and the Dow essentially giving up most of their year-to-date gains.   Small and mid-cap stocks are now underwater year-to-date.  However, the S&P 500 maintained its positive footing as the positive move in the large mega-cap tech stocks still maintain a 30%+ weighting in the index. 

Economic data provides a negative back drop, for now.

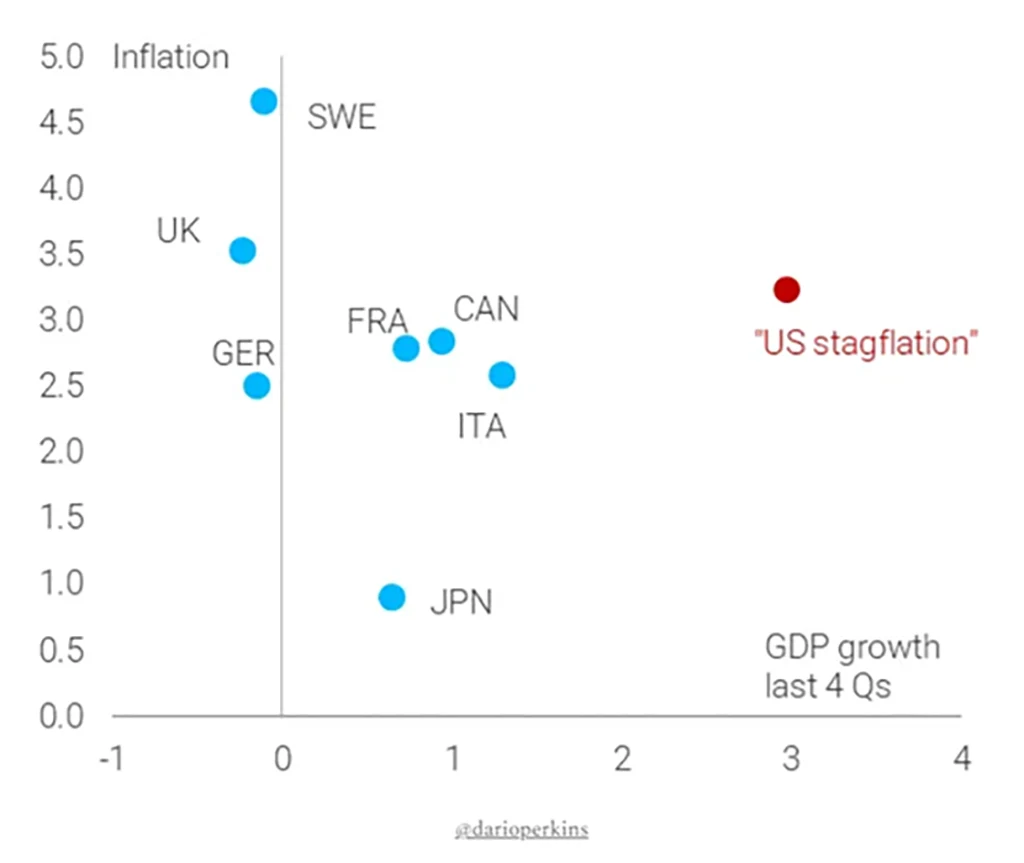
Thursday started out with a tepid GDP report of just 1.6% growth and higher first quarter inflation.  This immediately was picked up by investment analysts and news media as the “US Economy has hit STAGFLATION.”

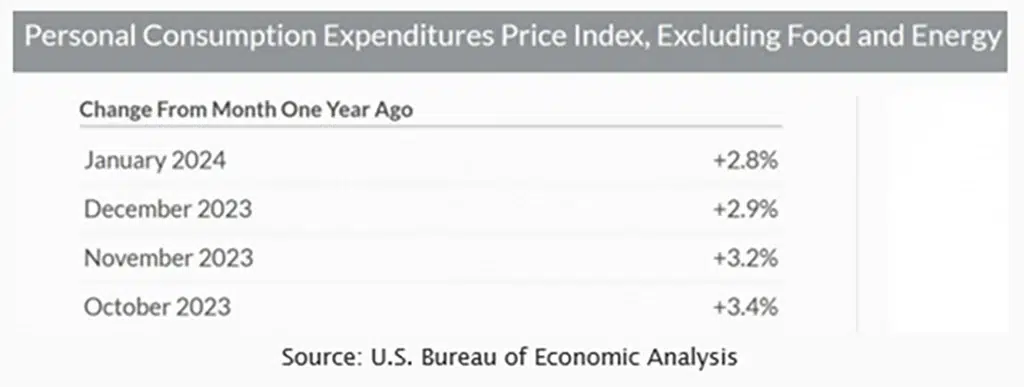
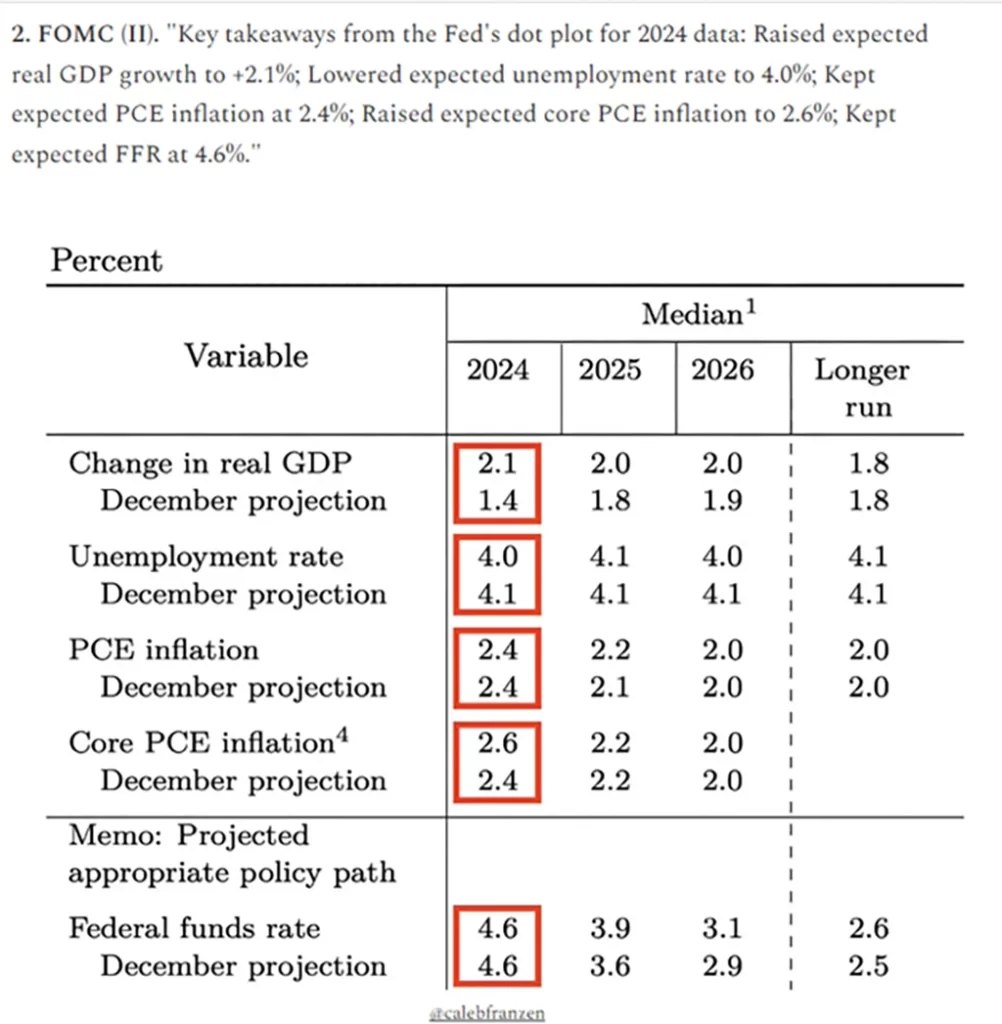
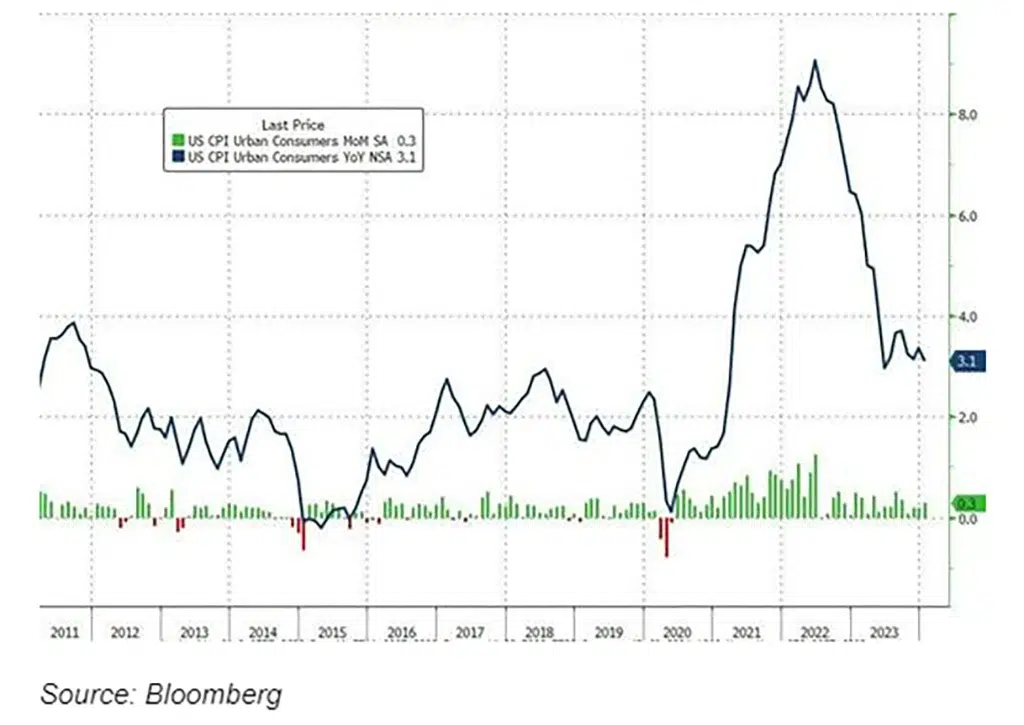
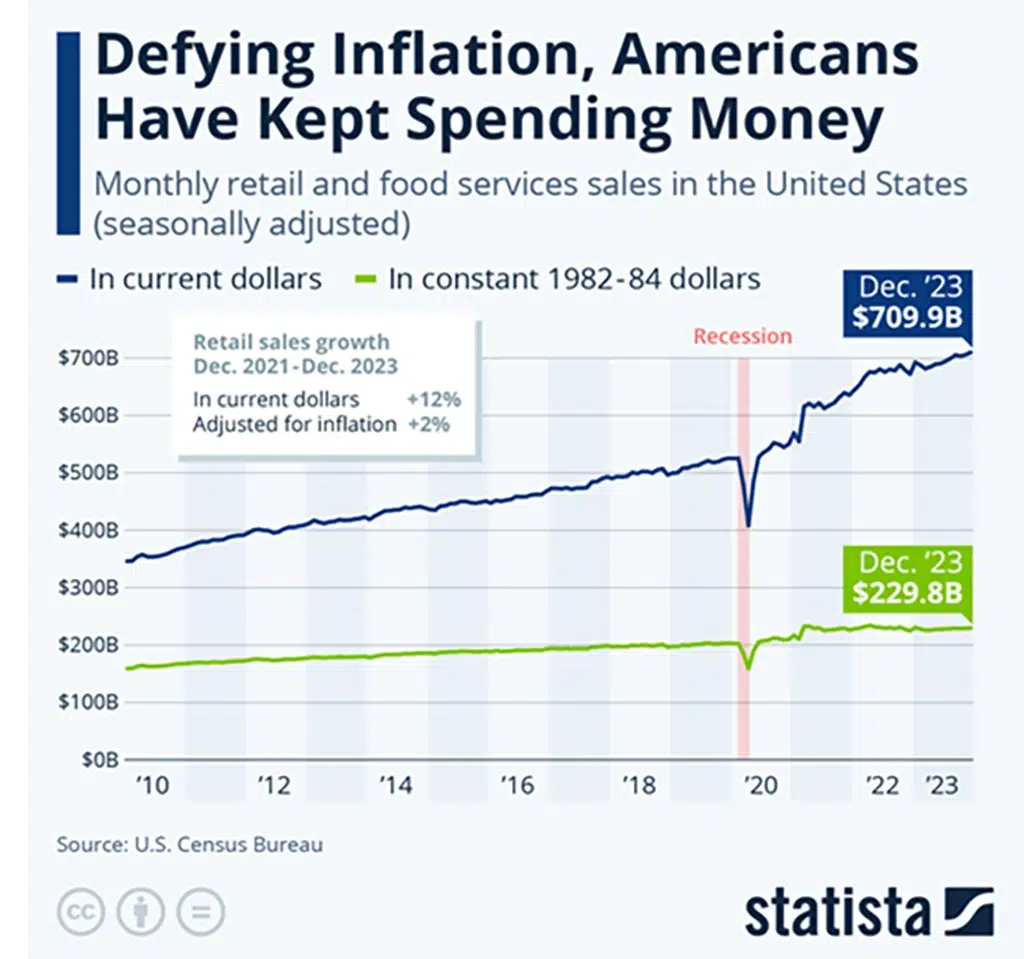
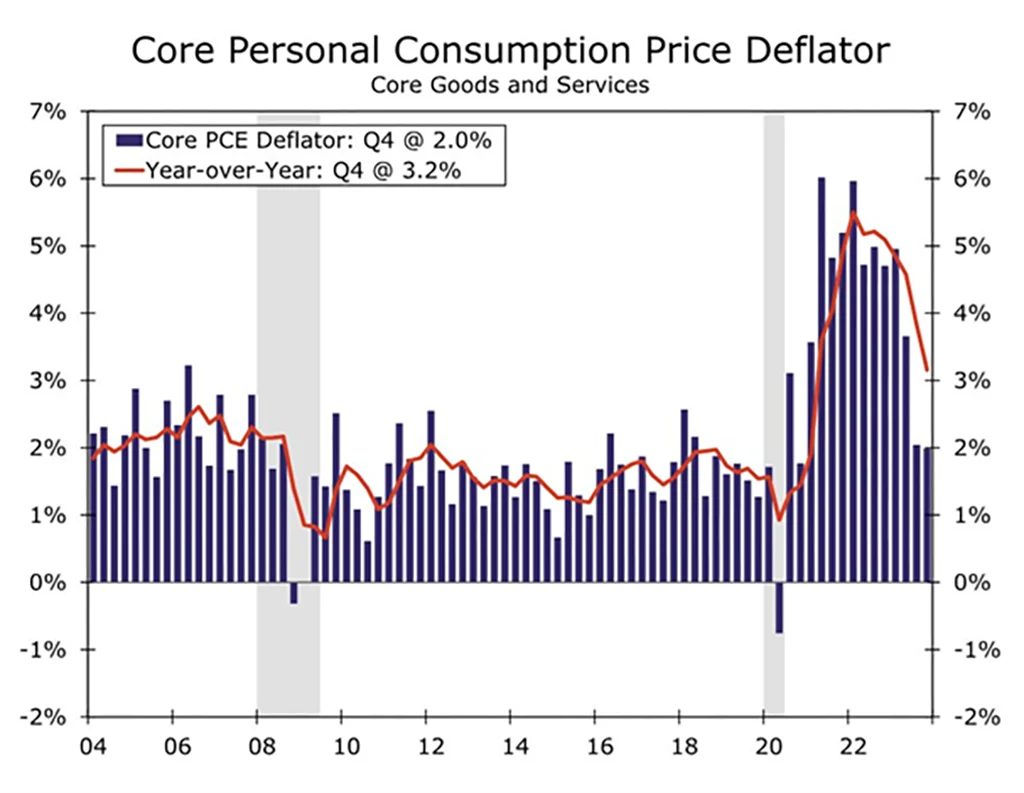
Friday, the core PCE data showed the uptick in inflation, which came out at 2.8% year over year versus the expectations of 2.7%.  The biggest driver to this was service inflation of 0.4% for the month of March.  Personal spending rose 0.8%, while personal income rose just 0.5% during this period.  A big negative to the report was the fact that the personal savings rate fell to 3.2% from 5.2% a year ago.  This speaks volumes that the consumer is tapped out, doesn’t have much more to spend to keep up with the inflationary environment, and the GDP report showed a dramatic slowdown in the growth of the economy. (Thanks to Jeffrey Hugh, www.jwhinvestment.com for some of these numbers)

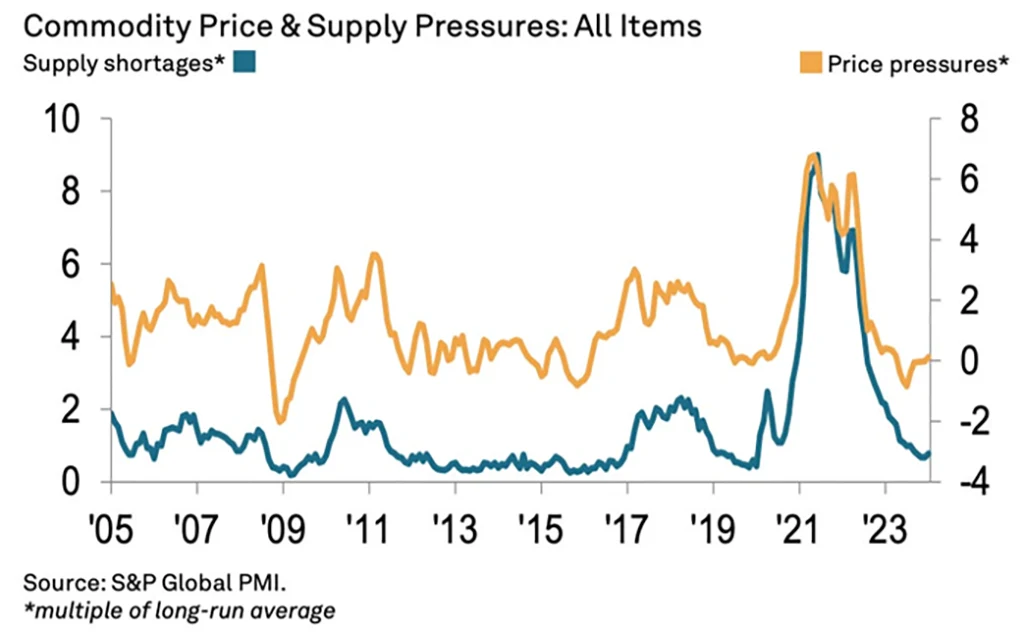
This is humorous to me, given that Mish has been on National TV shows, like Fox with Charles Payne, as far back as 9-12 months ago, suggesting STAGFLATION was coming.  Low growth and persistent inflation.  Now it seems every analyst and talking head utters this word (STAGFLATION) once a day.  Additionally, this word can be heard in other parts of the world as many developed countries’ economic backdrops look similar to those of the US: slow growth and elevated inflation.  See chart below:

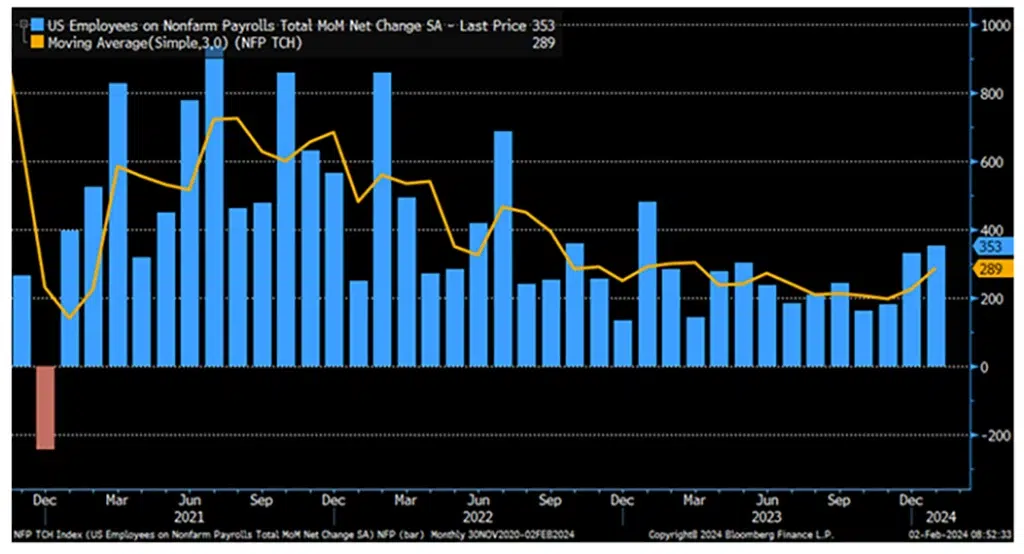
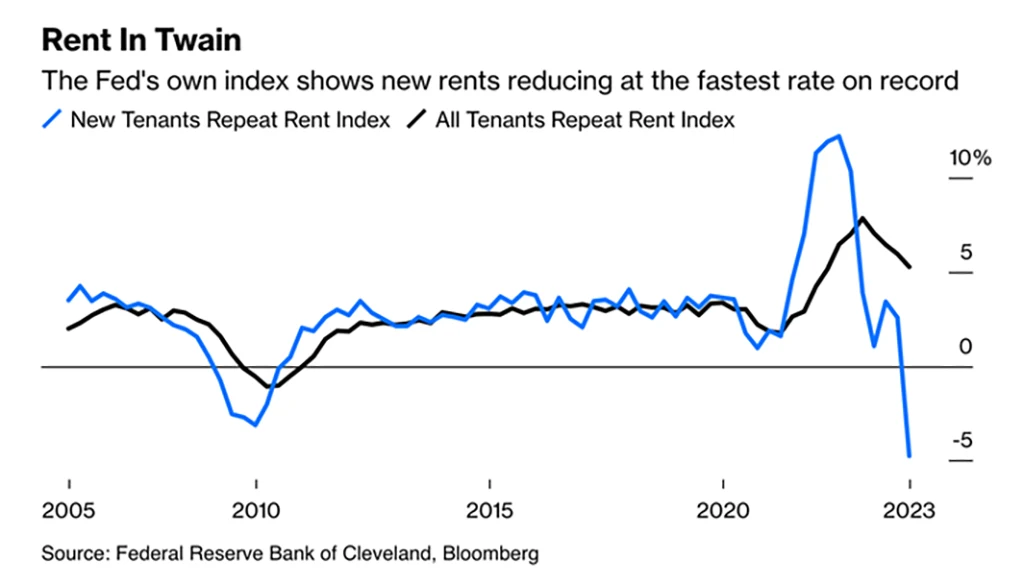
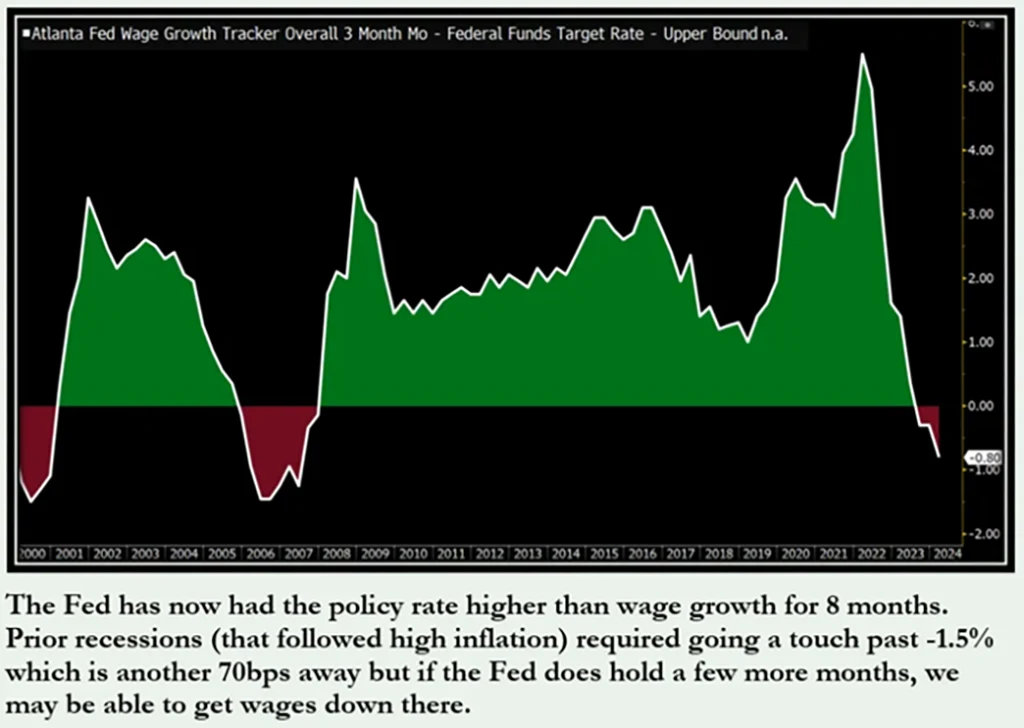
Wage growth is also slowing (not helping), which could reduce the savings rate and GDP in the near-term.  See chart below:

Don't Get The Weekly Newsletter? Join Here:

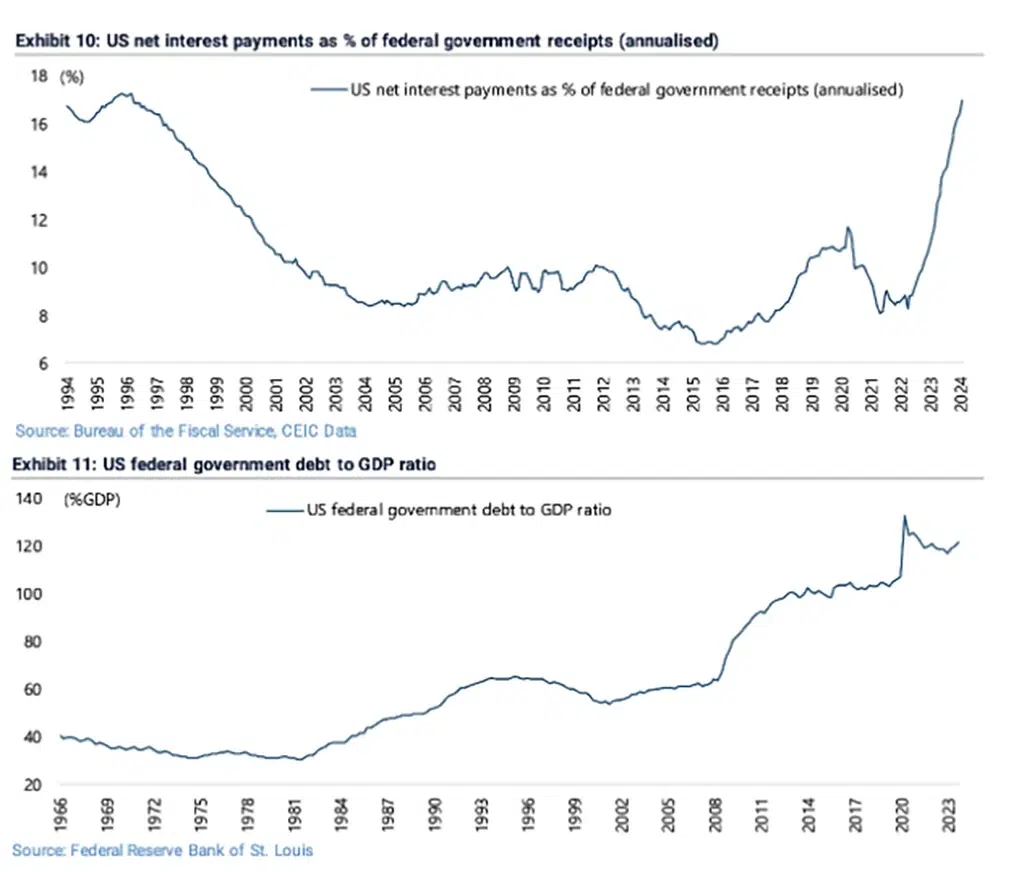
If one were to strip out government spending the past year ($6.8 trillion deficit in the past 12 months), one would see that we are actually in a negative GDP environment except for government spending. 

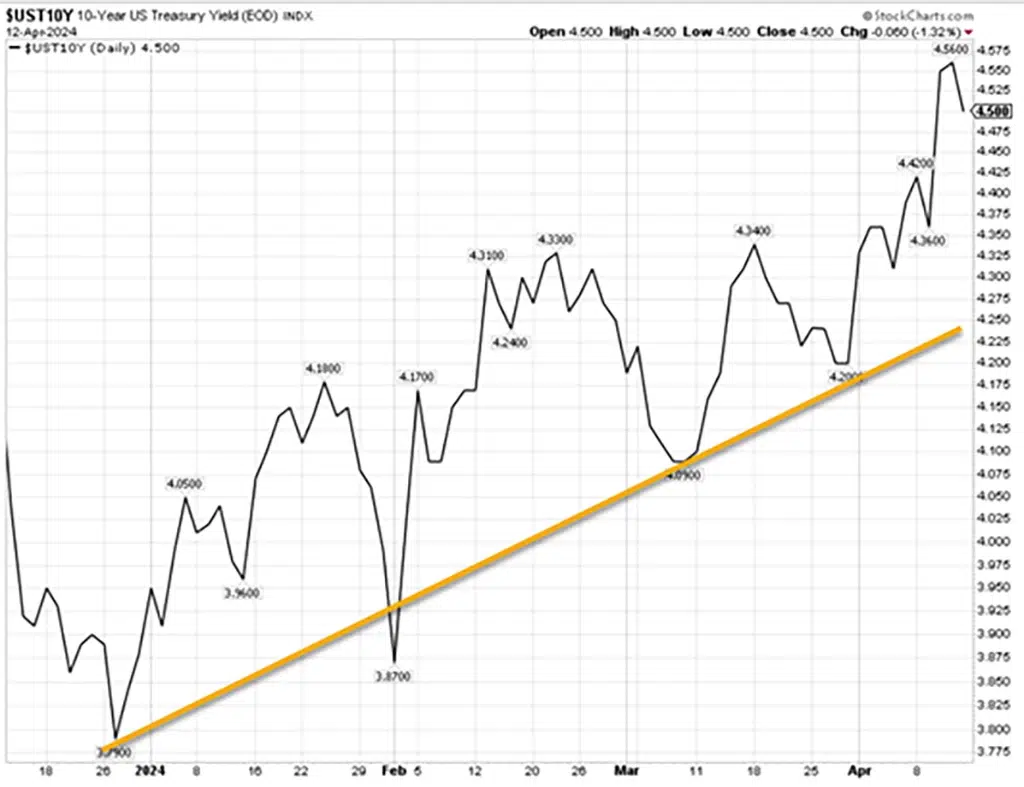
We have stated on the record frequently in this weekly commentary (and Mish has stated on social media as well as the TV airways) that we saw interest rates staying higher for longer.

We also want to be clear that earlier this year we suggested that there would be NO interest rate cuts by the FED until later on in 2024.  In fact, we have alluded to the fact that the FED should consider hiking interest rates instead of cutting them. 

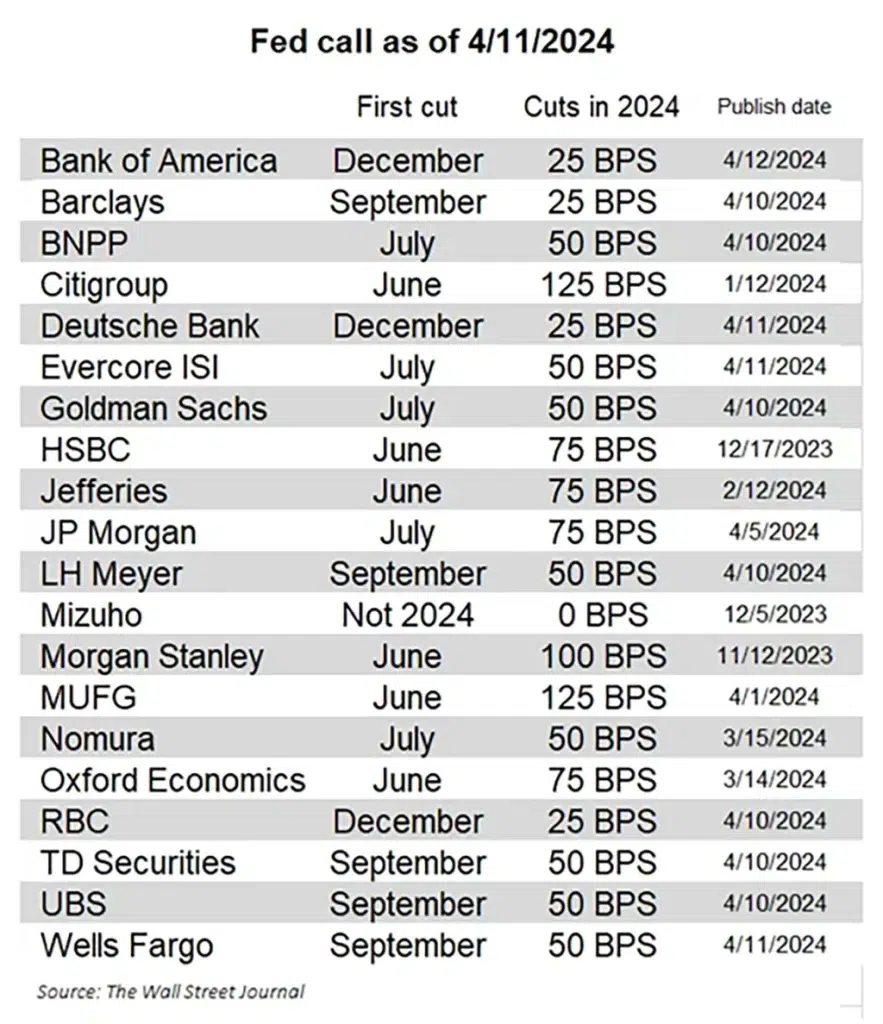
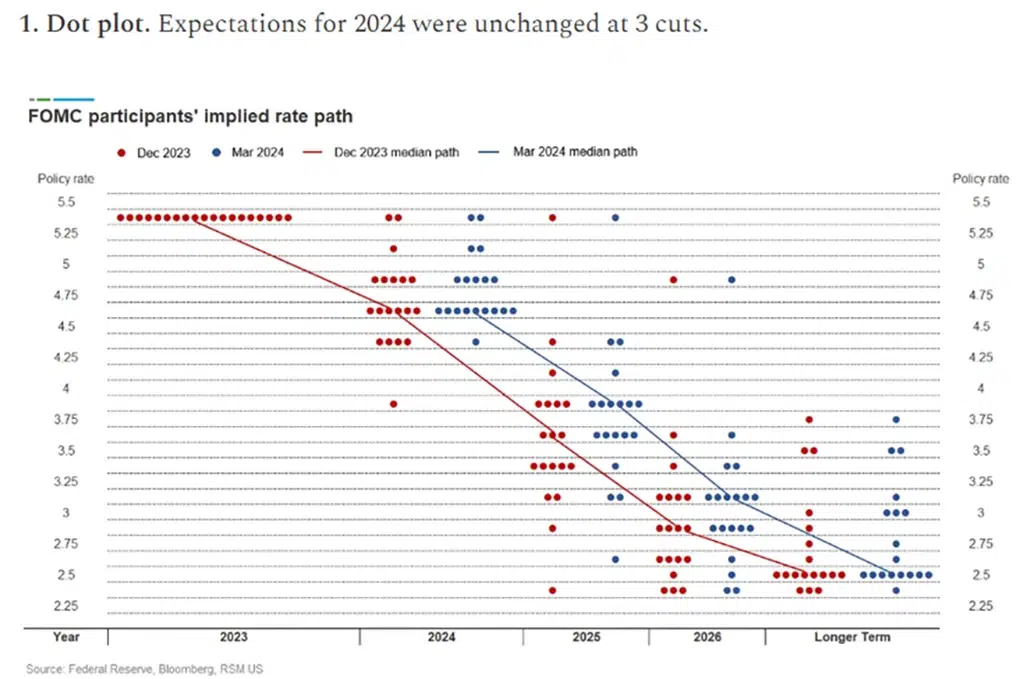
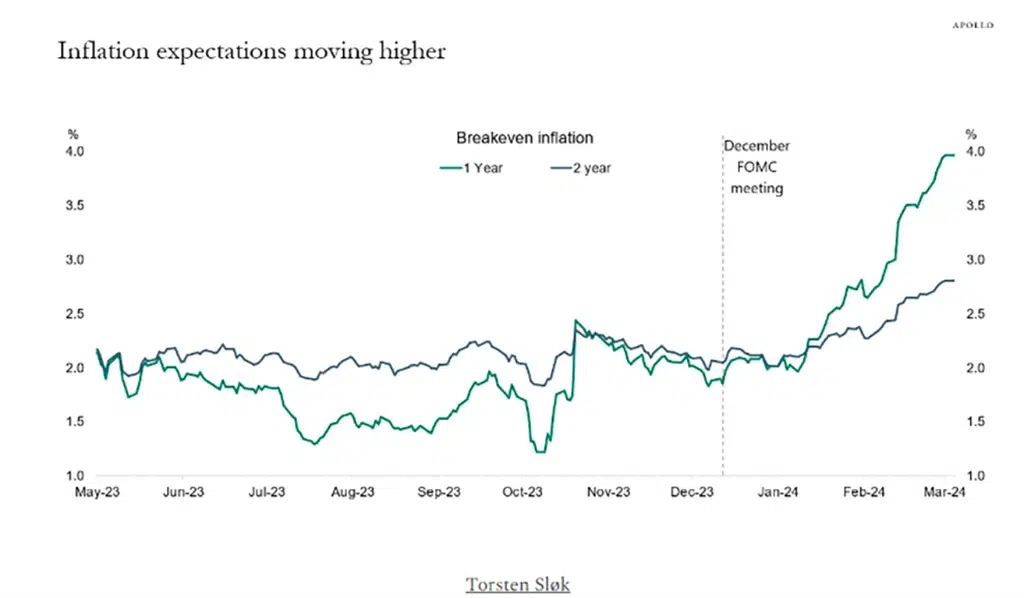
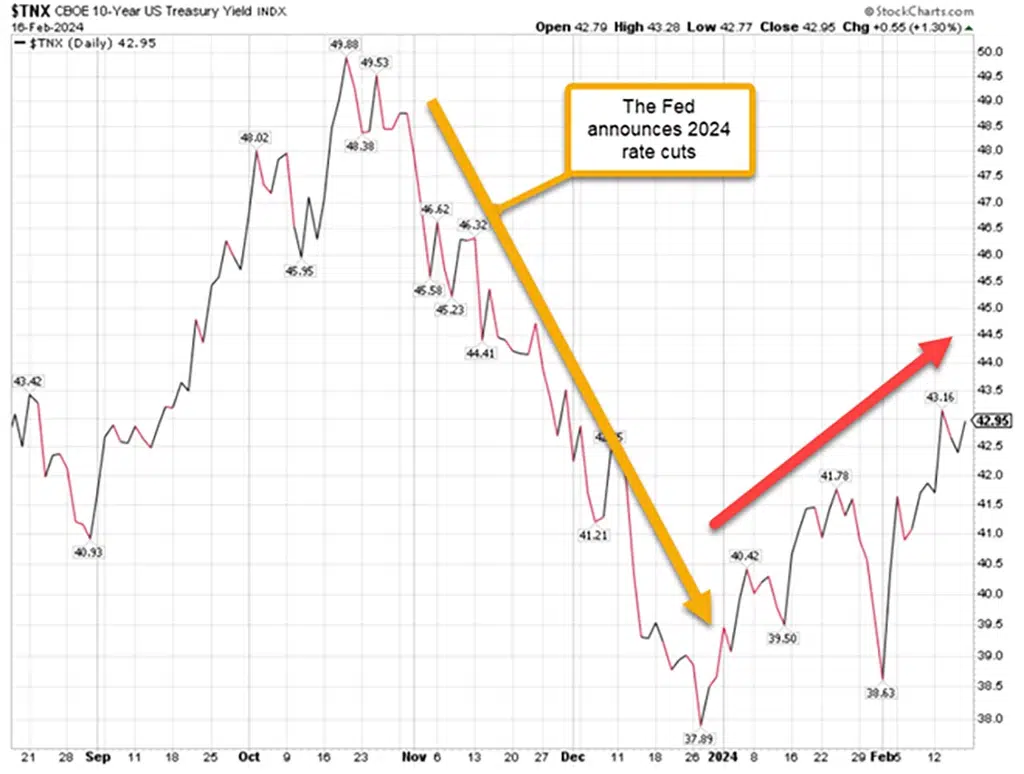
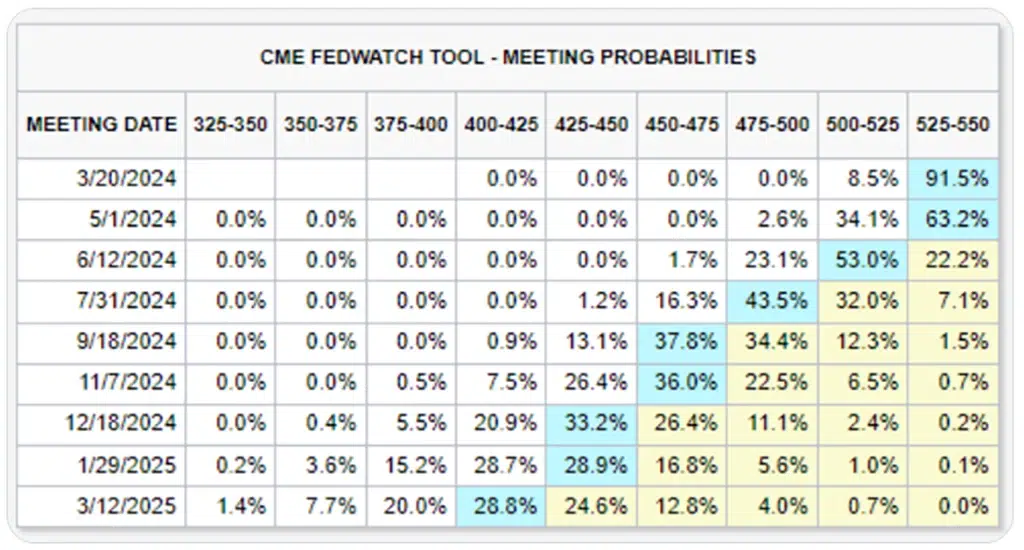
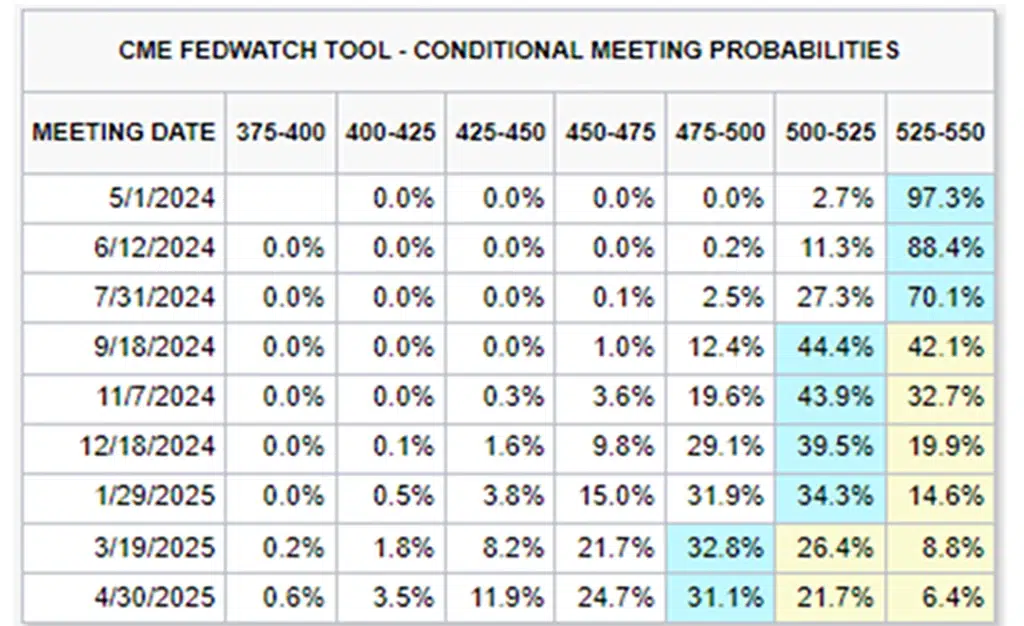
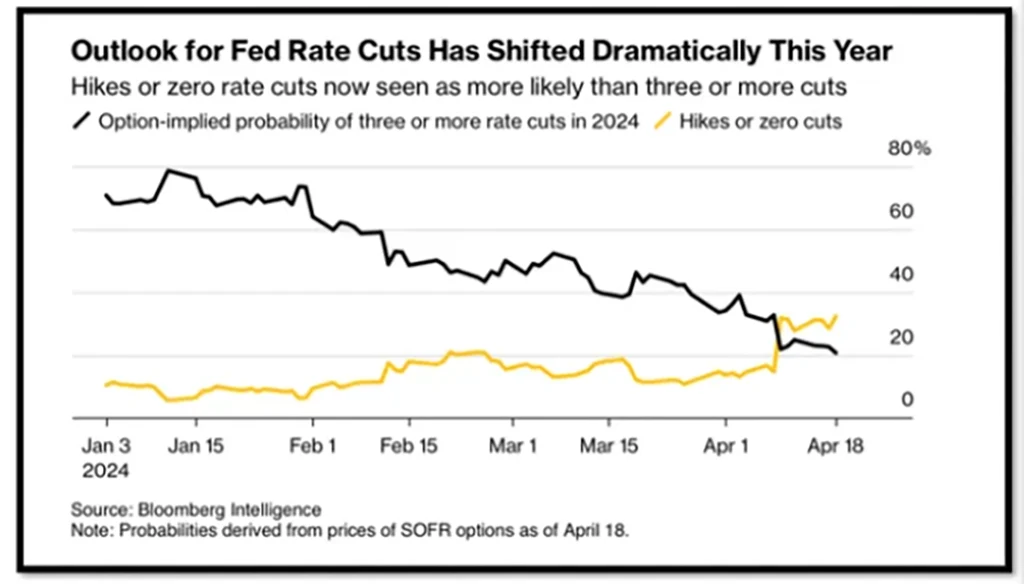
This week, the odds shifted dramatically from cutting rates at the June meeting to probably not cutting until later in the year, if at all.  Some expectations have also shifted to odds improving for another hike.  See the charts indicating this below: (Odds have shifted to no cuts until possibly September).

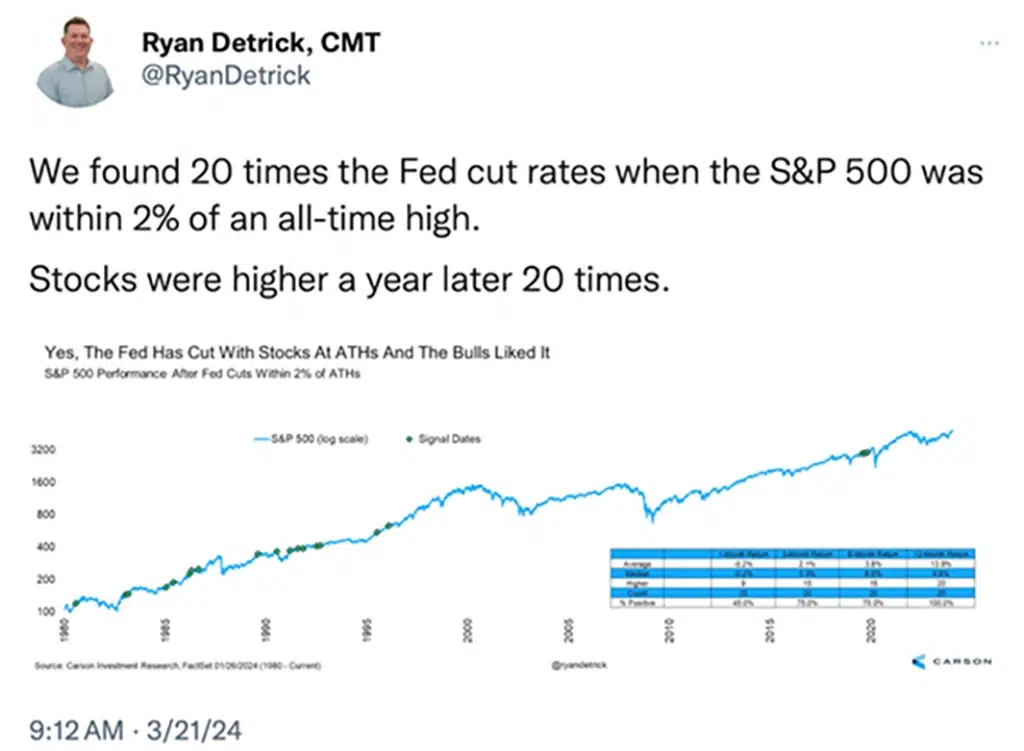
To us, it is a fact that the longer rates remain elevated, the greater the effect this restrictive monetary policy may have on the economy. This may result in the US economy slipping into a recession. If the market gets wind of this and breaks down then it would be highly likely the FED would cut rates to repair the damage done by a negative stock market and stifling economy. That is how it could play out.

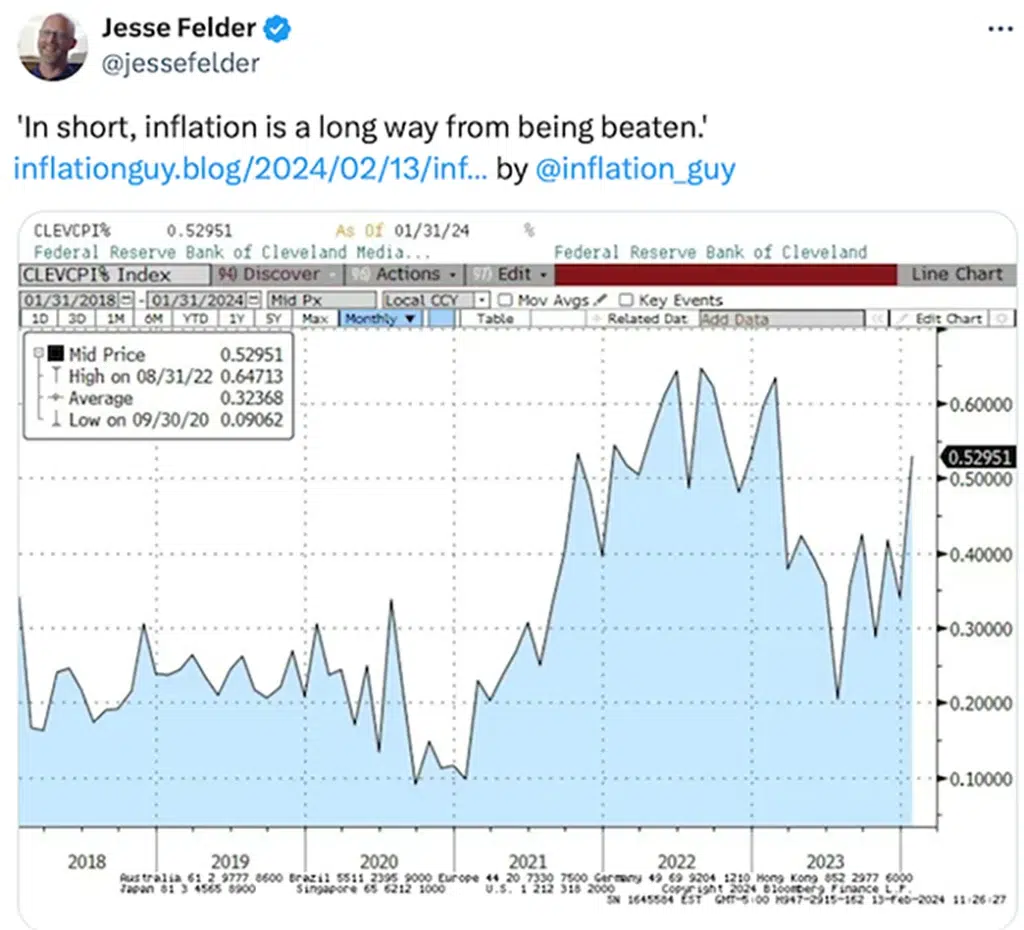
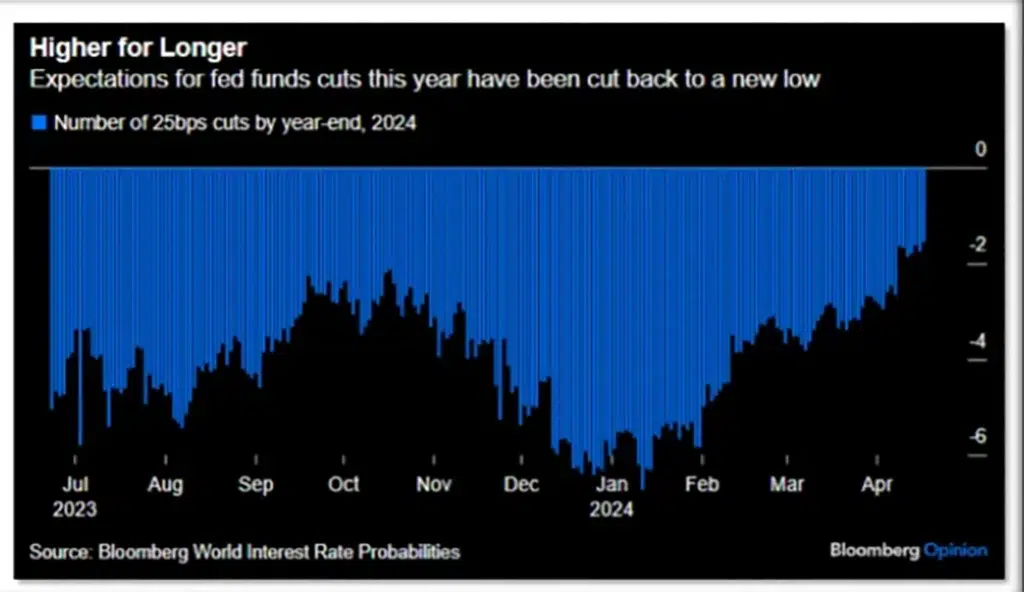
As we mentioned above, we could even see the Fed hike rates one more time if they feel that the recent uptick in inflation is too much. See the charts below showing how dramatic the Fed’s position has changed these past few months:

On the bright side.

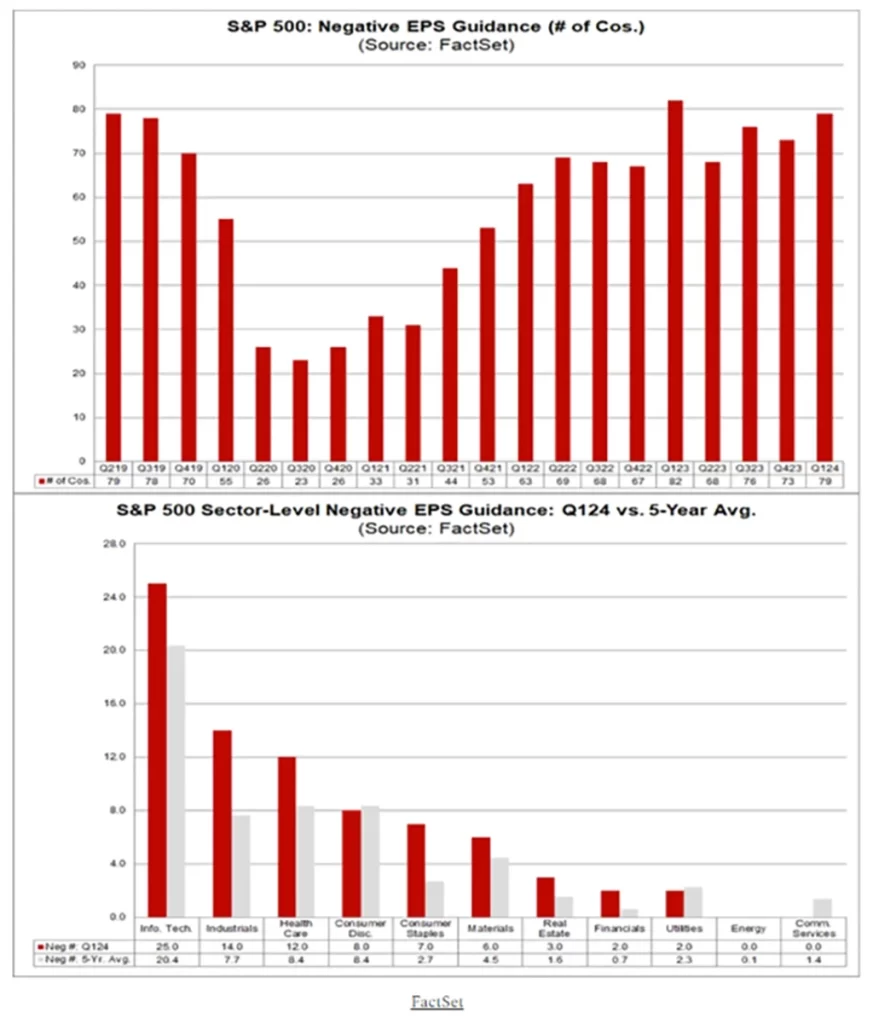
We are in earnings season and many of the companies that have reported so far have exceeded expectations. According to FactSet, 46% of S&P 500 companies have now reported their Q1 2024 results with 77% beating their earnings estimates and 60% reporting revenues above estimates.

These are good numbers so far and these earnings expectations may very well hold up the markets while interest rates stay high with inflation remaining elevated and sticky..

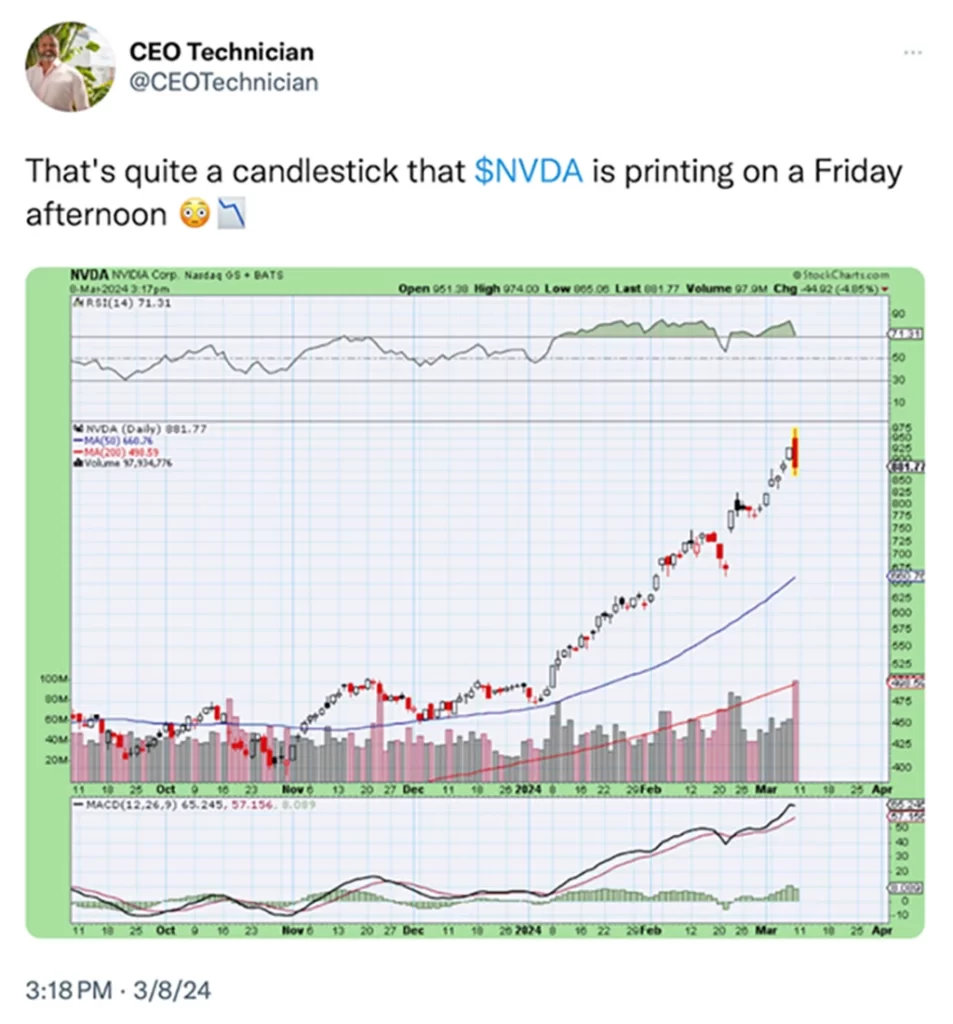
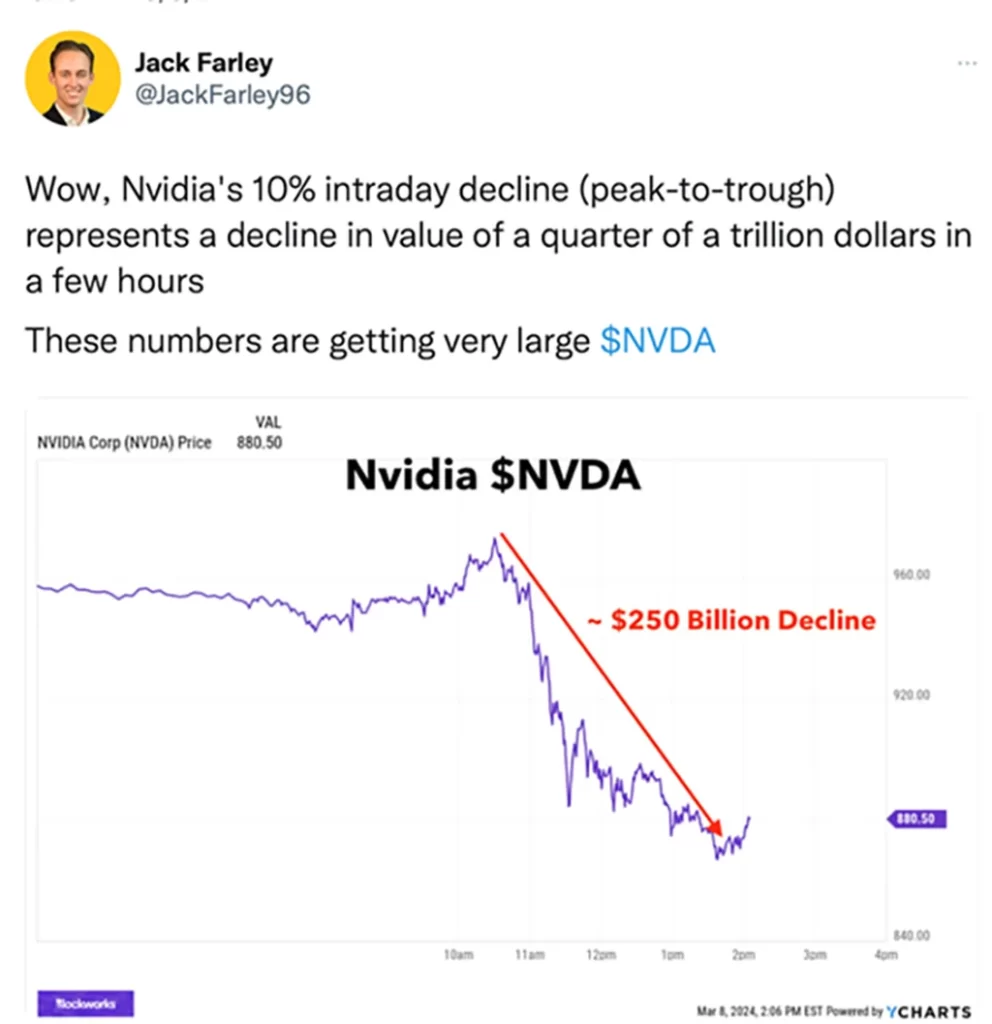
Such was the case this past week with three of the Magnificent Seven stocks. Meta (Facebook), Microsoft and Google all beat their expectations. Meta was down more than 10% after reporting a negative outlook for Q2. Microsoft and Google blew away earnings. These three companies (META, MSFT, and GOOG) all stated the same narrative during their earnings calls. They are upping their AI cap ex dramatically, and that helped MU, SMCI, and NVDA all have a BIG UP day on Friday as investors now more fully understand the semiconductor companies involved in AI are the biggest beneficiaries of this cap-ex spending cycle.

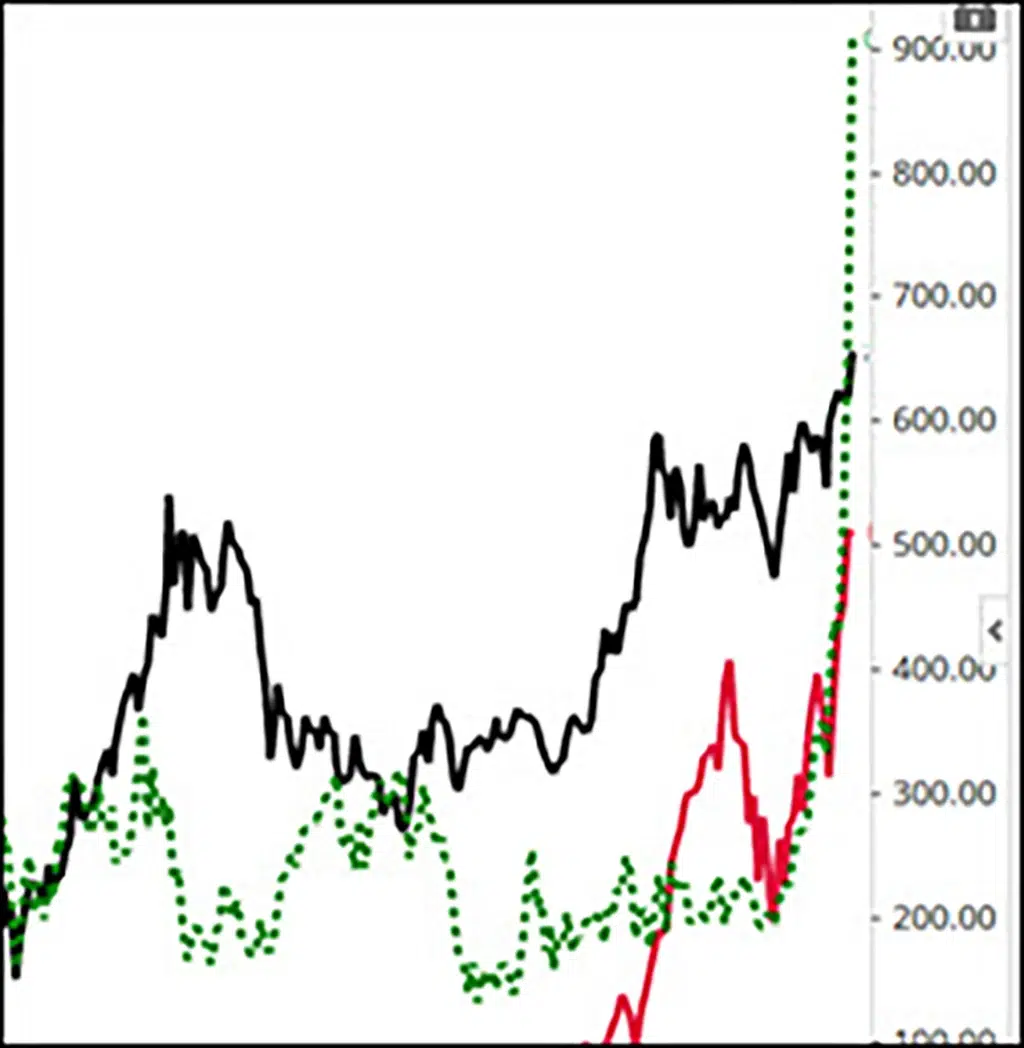
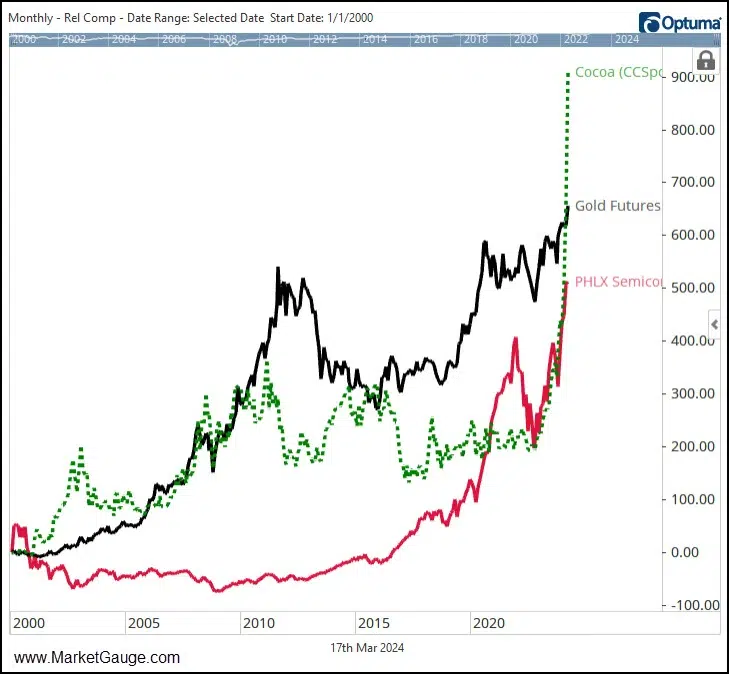
The NASDAQ was up 1.7% on Friday and 3.6% on the week. Semiconductor stocks, which were down over 9% last week regained their upward bias and were up over 9% this past week. See chart below:

Use the link below to continue reading about:

    • The brighter side of the market’s condition
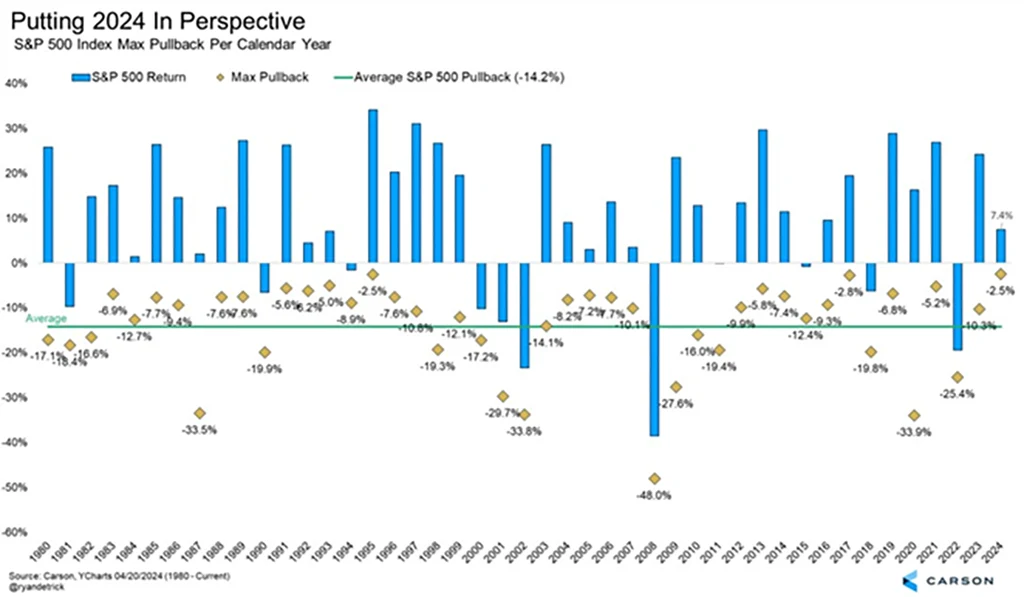
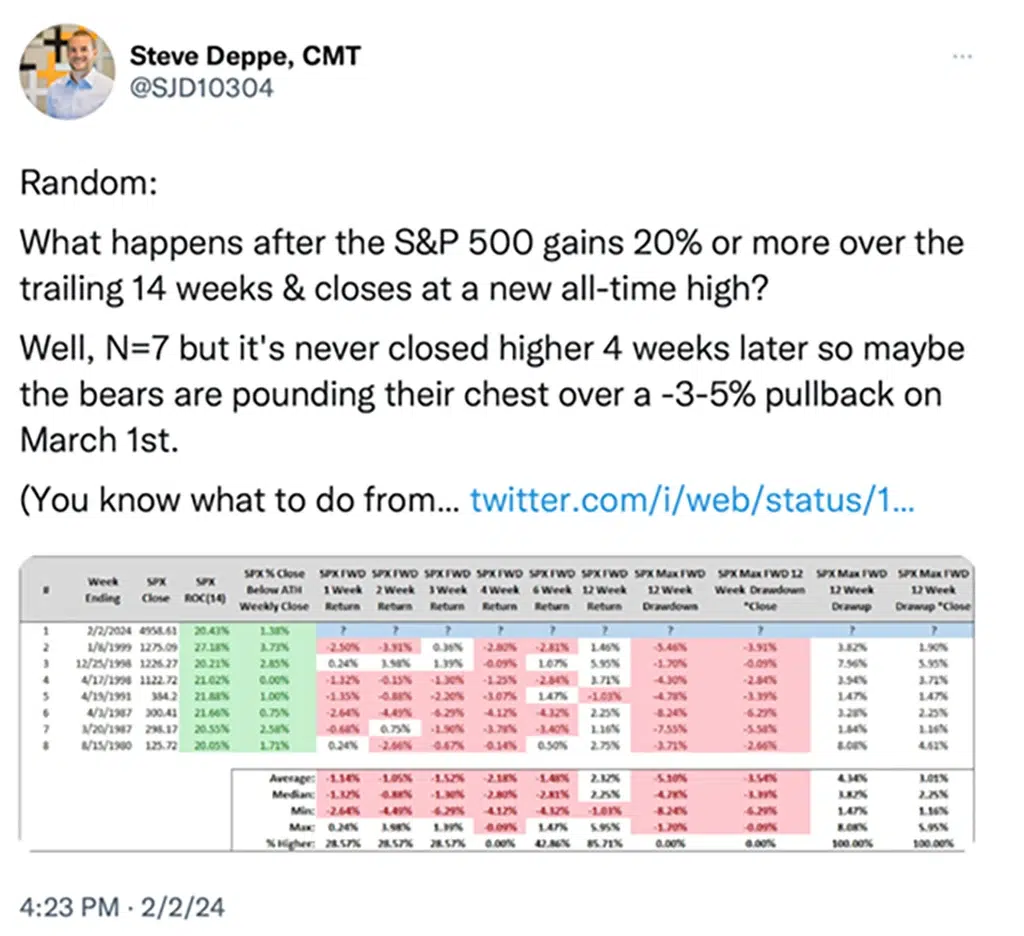
    • Statistical outcomes for the rest of the year based on current trends
    • Investor sentiment and positioning
    • The Big View bullets
    • Keith’s weekly video analysis
    • And more
The market’s price action and news flow can be confusing and intimidating, but investing in this environment doesn’t have to be. If you would like personal guidance and hands-on management of your assets with the assistance of tactical, risk-managed, strategies, please contact me at donn@mgamllc.com or Keith at keith@mgamllc.com.

Regime Change In The Stock Market?

Weekly Market Outlook
By Keith Schneider
April 24, 2023

Considering that equity markets in the US got hit hard last week with the NASDAQ 100 giving up most of its gains for the year (down over 7% over the past 30 days) and now only up +1.25 % for the year, the question is what does that portend going forward? And of course, the question of what is happening and why? There are multiple factors that need to be considered.

First, the AI revolution that has driven the magnificent 7 and equities through the roof got way ahead of itself with a blow-off top in early March this year. A bearish engulfing pattern in Semis and NVDA occurred at all-time highs in both and was the clue that the huge rally might be ending.  However, it took over a month for the market to confirm that the bearish short-term pattern was legit. NVDA has been a key driver of the move up in equities, moving from just above 100 in October 2022 to 970 by March 2024. One thing for sure is risk management is key in this environment and our trading models sold a portion of its holdings at 960. By the close this Friday, NVDA backed off 10% on the day, closing at 760.

Also, it’s important to note that the action in gold and silver confirmed that a potential top was in as well. Gold exploded to the upside, breaking out to new all-time highs and up almost 15% since March. Typically, gold does not like higher interest rates and a strong dollar. Nonetheless, Gold’s move up shocked many professionals. So, Gold’s sensitivity to geopolitical risk superseded its sensitivity to higher interest rates and a strong dollar, which was yet another clue that the market’s bull run might be running out of steam.

Additionally, soft commodities have also moved up sharply (food prices are exploding), driving inflation up and wreaking havoc on the markets’ expectations of lower rates. Our GEMS trading model has capitalized on these shifts and is outperforming all key benchmarks, moving out of equities into GLD, Silver, DBA, and exiting Semis.

Don't Get The Weekly Newsletter? Join Here:

The big takeaway, at least for now, is that value stocks (VTV) are now leading growth stocks for the first time since June 2022, according to our leadership indicator, both on a daily and weekly basis.

On a final note, Mish’s Daily covers some especially important rotations within the Modern Family, Bitcoin, and Junk Bonds with actionable information.

Use the link below to continue reading about:

    • The Big View bullets
    • Keith’s weekly video analysis
The market’s price action and news flow can be confusing and intimidating, but investing in this environment doesn’t have to be. If you would like personal guidance and hands-on management of your assets with the assistance of tactical, risk-managed, strategies, please contact me at donn@mgamllc.com or Keith at keith@mgamllc.com.

Unexpected Inflation Headline! Who Should You Believe?

Weekly Market Outlook
By Donn Goodman
April 17, 2023

Welcome back loyal readers to the weekly Market Outlook. We hope you had a good week, albeit a turbulent and difficult week for investors in the market.

The surprising (and unexpected) headline Wednesday morning on the CPI (Consumer Price Index) released at 8:30 a.m. EST, came in at 3.5% for March, significantly higher than February’s 3.2% (which was higher than expected in February).

This shocked the stock and bond markets and indicated that inflation is proving “stickier” than the Fed would like.

The market was down over 1% on Wednesday for most indices (down over 2% on small-cap stocks). However, a meaningful rally on Thursday recovered most of that down move from the day before.

On Friday morning, the PPI came out much more tame (good news). However, headlines regarding bank earnings, tensions in the Mideast, higher than expected interest rates, and negative earnings expectations heavily driven by JP Morgan’s earnings conference call spooked the market yet again. The markets gave up all of Thursday’s gains plus some.

For the week, the S&P was down -1.5%, the NASDAQ 100 was only down 0.50%, but small-cap stocks (IWM) sank the most at -2.8%. That makes sense, given the much greater dependence that smaller companies have on interest rates. See chart below:

Fixed income funds and anything related to interest rates (small & midcap stocks) were most effected this past week.  We wanted to illustrate just how quickly the 10-year interest rates reacted to the higher CPI number that came out.  We illustrate this in the two charts below.  The first is the most recent action since April 1 and the second is the rise in interest rates since January 1, 2024. 

Since April 1, 2024, the 10-year interest rate has increased 5%.  See below:

Since January 1, 2024, the 10-year interest rate is up 20%

In the grand scheme of things, we are still close to new all-time highs set by the S&P 500 on March 28, 2024. Since then, we have seen a pick up in volatility and the daily market swings, but we are only down -2.3% since hitting the last all-time highs on March 28, 2024. Putting this in perspective is Ryan Detrick’s chart below:

The S&P 500 has still only had a 2.5% peak-to-trough move in ’24.
This would tie it with ’95 for the smallest ever.
The reality is more pain at some point this year would be perfectly normal.
Remember, as strong as last year was, stocks still saw a 10.2% correction.

Don't Get The Weekly Newsletter? Join Here:

Are we in for more downside?  We will explore this shortly.

Who are you to believe? 

There is a ton of news out there daily with contrarian points of view about our economy, inflation, debt, the markets, geopolitical risks, and an additional handful of potentially market moving data.  Then there is what the Fed says.

Between Mish’s daily (you should be a subscriber and if you are not, why not?  Go here to sign up for her daily musings and this weekly Market Outlook, as well as our vital BIG VIEW tools, you should have all you need to make intelligent investment decisions.  

Add to that our easy to navigate, consistent outperforming investment strategies (with risk management) and you are well prepared to maneuver these markets and game plan for what might occur if we get into more difficult market conditions.

Starting late last year both Mish and I were redundant in our calls for “Higher for Longer” with respect to interest rates as well as inflation.  We both repeated this mantra over and over.  Mish was very clear when she laid out her projected path that historically inflation is stickier than investors are expecting.  Inflation doesn’t just disappear overnight.   Additionally, with all of the Government spending continuing, there is still an abundance of quantitative lubricant in the economy that will show up as inflationary.

Going back to the fall of 2023, we indicated that inflation was around for a much longer time than the deceleration that the analysts and pundits were projecting.  Moreover, both in late 2023 and early 2024 we suggested that our opinion is that interest rate cuts would come later in 2024 and not be anywhere close to 6-7 times.

Since the beginning of the year, we were unequivocal in our belief that interest rate cuts wouldn’t happen until after midyear.  The last two weeks (you can access the Market Outlook for the past two weeks here) we suggested that we were likely to see 3 or less interest rate cuts, if any.

Bloomberg reported on Saturday that there are now two new possibilities for the global inflation fight.  First, the European Central Bank (ECB) may attempt something that diverges from the US.  They are suggesting they will cut in June “even if the US holds fast”.  “It’s time to diverge,” Bank of Greece Governor Yannis Stournaras said.  “The situation in the euro area and the US are completely different.” 

The other possibility?  Brace yourself, said Bloomberg. If US inflation remains sticky, the Federal Reserve might do more than simply push back rate cuts.  How about another rate hike?  Bloomberg pointed out that robust consumption and investment as well as easing supply-chain problems, have fueled strong US growth despite higher interest rates. 

Most of the investment banks have recently changed their tune.  We provide below a comparison of what the big banks are saying about interest rate cuts in 2024:

“The March inflation report triggered a jailbreak by the sell-side bank and other Fed forecasters, who largely abandoned prior calls for a June cut. Most now see the first cut no sooner than Q3, and there’s been a lot of movement towards expecting just one or two cuts this year.”

Market Uncertainty Will Continue

There has been a sharp pickup in the volatility readings indicating that fear is slowly creeping back into the markets.  Given that Wednesday and Friday were two very volatile down days, we would expect this. 

This is also being promulgated by the heightened geopolitical risk in the Middle East as well as Russia’s war rhetoric regarding NATO countries is not helping.  We can see that both inflation and geopolitical risks are taking hold in the metals markets as Gold and Silver and even Copper are making new daily highs. (for Gold it is new all-time highs, but if you factor in the declining value of the US $ along with inflation, we are not yet really at all-time highs).  See volatility (VIX) chart below:

There are negative and positive signs on what the stock market may do in the near future.  We present both the positive and negative points of view below.

Use the links below to continue reading about:

    • April’s late month pattern
    • The QQQ’s 4th strongest week of the year is near
    • Corporate insiders’ buying at its lowest in over a decade
    • Large money managers moving rebalancing out of tech
    • Gold at an historically overbought level
    • The Big View bullets
    • Keith’s weekly video analysis
The market’s price action and news flow can be confusing and intimidating, but investing in this environment doesn’t have to be. If you would like personal guidance and hands-on management of your assets with the assistance of tactical, risk-managed, strategies, please contact me at donn@mgamllc.com or Keith at keith@mgamllc.com.

Warning Signs Ahead – Commodity Super Cycle?

Weekly Market Outlook
By Donn Goodman
April 10, 2023

Welcome back to our weekly Market Outlook.  Glad to have you.  We hope you had a good week following a Happy Easter!

Like you, we are pleased that the Economy and the Markets are on firm footing.  However, we are starting to see warning signs that the economy could slow drastically and/or the stock market may enter a much-needed period of consolidation or perhaps even an overdue correction.

It is worth noting that both the economy and the stock market have made solid advances over the past 18 months.  However, as Mish pointed out throughout the latter part of 2023, inflation is sticky and may be elevated for a significant period of this year and into the next few years. First, let’s explore the economy and address investor sentiment and the stock market.

Warning Sign: The Economy

Friday, we had a blowout US jobs report.  This eliminated and possibly delayed many of the fears of the pundits, talking heads, and analysts who have been suggesting that the economy might be in a bubble. 

US payrolls increased by 303,000 in March, topping all estimates.  The unemployment rate edged lower to 3.8%. Wages grew at a solid clip and workforce participation rose, underscoring the strength of a labor market that is clearly driving the economy right now.

“It’s hard to find anything wrong with the March jobs report,” said Steve Wyett at Bok Financial, “The only people who might be disappointed in today’s report are those looking for relief from Fed rate cuts.  We still expect the next move from the Fed to be to lower rates, but there is little sense of urgency at the moment”.  See chart below:

Warning Sign:   In the meantime, US employers announced more than 90,000 job cuts in March, the most since January 2023.  Total job cuts announced in Q1 were down 4.9% from Q1 2023 but up 120% from Q4 2023.  This is one of the warning signs that higher interest rates and, even more importantly, higher wages may be affecting corporations’ efforts to begin cutting staff. 

Additionally, the integration of AI into corporations’ labor forces is expected to increase productivity. This may eventually allow companies to do more with fewer people.  See job cut chart below:

Warning Sign:  Deterioration of the ability of the Government to pay its debt.  US net interest payments have reached the highest level (top chart below) since March 1996.  Back then, debt-to-GDP was just 64%, whereas today, it is 122%.  Both charts can be seen below:

Our concern:  In November 2023, Jerome Powell (Chairman of the Federal Reserve) announced that they plan on several rate cuts in 2024.  Some investment firms and analysts interpreted this (and the dot plan) to mean there could be as many as 6 rate cuts throughout 2024, starting as early as March 2024.

Back then, you will recall that the stock market took off given the forecast that the Fed would loosen monetary policy and that inflation would revert to the Fed’s stated objective of 2.0%.  We thought otherwise and have gone on the record that we did not see any rate cuts happening until midyear, at the earliest.  We also thought that there might be only 2-3 cuts in 2024, not the 6 many people bought into late last year. 

All through the fall and recently, we have stated “higher for longer”.  

Also, last fall we showed the 10-year Treasury charts trending downward below 4.0%.  We cautioned our subscribers that we might see the 10-year rate back above 4.0% given our belief that inflation could re-accelerate in 2024. Mish wrote several pieces that show what happened in the 70s and our belief that inflation will not come down so soon.   Friday, the 10-year closed at a multi-month high of 4.4%. Real inflation as reported last month, is still running close to 3.0%, far from the Fed’s stated objective of 2.0%

Warning Sign:  No rate cuts this year. 

Thursday, US Federal Reserve Bank of Minneapolis President Neel Kashkari said interest rate cuts may not be needed this year. This was probably the last thing impatient investors wanted to hear. It’s good for savers, but bad for stock market investors.

He called the January and February inflation readings “a little bit concerning” and said he needs to see more progress on prices to gain confidence that they’re moving toward the Fed’s 2% target.  “In March, I had jotted down two rate cuts this year if inflation continues to fall back towards our 2% target”, said Kashkari on Thursday. “If we continue to see inflation moving sideways, then that would make me question whether we needed to do those rate cuts at all.” 

The market sold off, with the S&P down over 1.2%, the QQQ down over 1.5%, and small cap stocks, the least stretched of the indices, down about 1%. On Friday, a few other ex- and current Fed Governors gave their opinion (after the jobs report) that inflation was still trending down, and the market cheered that the prospect of interest rate cuts was still on the table. 

There were comments in the news after the dust settled Friday from the jobs report issued on Friday. Here is one which we happen to agree with:

There’s ‘no way’ the Fed is cutting 3 times this year, says Craig Johnson

Piper Sandler managing director and chief market technician Craig Johnson reacts to Federal Reserve Chairman Powell’s remarks on rate cuts, oil prices and jobless claims.

More Warning Signs: Investor Sentiment and the Stock Market

If you are a regular reader of this weekly column, then you are well aware that in the past few weeks, we have published numerous historical charts showing that when the first three months are positive, the year is positive, and what occurs after 5 straight positive performance months.  All good ammunition for staying long the markets. 

 If you did not have a chance to read last week’s Market Outlook or would like to review it again, please click here to do so.

You should also know that most of the MarketGauge indicators are currently showing “risk on”.   This will be further elaborated in the Big View section and on Keith’s video that follows.

There are warning signs, however.

Here are 8 warning signs that the market may move sideways or correct in the next few quarters. 

1.) The % of consumers expecting higher stock prices is at 49.3% per the Conference Board. That number has only ever been higher once in January 2018 at 51%.  Following that instance, the SPY generated negative returns over the next 1, 3, 6, 9, and 12 months.  See chart below:

Don't Get The Weekly Newsletter? Join Here:

2) The first quarter’s earnings-negative guidance. Both the number (62) and percentage (71%) of S&P 500 companies issuing negative guidance for Q1 rank as the second highest ever.  YES, earnings growth this past quarter had been higher than expected as companies reported good numbers.  However, it doesn’t appear this is sustainable for the remainder of 2024.   See earnings guidance chart below:

3.) Nasdaq vs. cycle lows.The Nasdaq’s “performance since its December 2022 bottom is lagging every rally off its 4 prior cycle lows.”

4.) Investor Sentiment is at an extreme. Historically these extremes are typical when we begin to see signs that the market has peaked and may go into a consolidation or corrective period. The warning signs show sentiment readings that are very bullish, AND the bears are at a low extreme, creating the bull-bear spread to be at an extreme ratio.  See chart below. 

Use the links below to continue reading about:

    • Additional warning signs that the market may stall or correct
    • The evidence and reemergence of a commodities super-cycle
    • The Big View bullets
    • Keith’s weekly market analysis video
    • And more
The market’s price action and news flow can be confusing and intimidating, but investing in this environment doesn’t have to be. If you would like personal guidance and hands-on management of your assets with the assistance of tactical, risk-managed, strategies, please contact me at donn@mgamllc.com or Keith at keith@mgamllc.com.

An EGGS-CELLANT First Quarter For Stocks!

Weekly Market Outlook
By Donn Goodman
April 03, 2023

All of us at MarketGauge hope that you and your families enjoyed an extended holiday weekend and you were able to participate in this season of renewal.  We wish you and your families a warm Spring and a profitable upcoming second quarter of 2024.

We will jump right into this Market Outlook by conveying the obvious… what a positive and profitable month of March and first quarter 2024 it has been (unless you are a doom and gloom newsletter writer or a major short-selling hedge fund)

If you have time, please go back and revisit our recent Market Outlook columns in the Big View section of your subscriptions to see just how many times since late last year we suggested you take a bullish bias towards the stock market along with numerous charts showing that buying at new all-time highs historically has led to more gains and additional new all-time highs. 

When the market hit its first few new all-time highs, we began to also convey that it was a good time to buy the market.  Most of our individual strategies have stayed fully invested during this time, helping our followers to profit from the continuing trends in the markets. 

We have now witnessed 21 new all-time highs in the S&P 500.  Today, we would like to illustrate where many of the gains during the month of March and the first quarter of 2024 have emanated from.  Then, take you through a few charts and narrative about what we might expect for the remainder of the year.

The S&P 500 Index

Thursday, the S&P 500 closed at yet another record high, concluding a positive week, month and quarter.  As of Thursday’s close, 86% of the S&P 500 stocks are above their 200-day moving averages, marking the first weekly close above 80% since August 2021.   See chart below:

Our own proprietary chart that applies moving averages on the expanding or contracting # of stocks above the 200-day moving average within the S&P 500 showed weakness in early February and then picked up momentum in early March and currently shows a GREEN light and positive bias heading into the second quarter of 2024. See chart below:

Grant Hawkridge below points out that when breadth returns to healthy levels (80%) after a washout, it often stays elevated for several months or even years before deteriorating.

The takeaway: The S&P 500 survived on narrow breadth, but it could really thrive now that more stocks are participating. 

Major Market Index Performance

To convey just how good the market’s performance has been for the first quarter, we offer the following

Don't Get The Weekly Newsletter? Join Here:

Of course, we are not suggesting that it will be a straight line up and not come close to the annualized returns shown above, but it is important to keep in sight just how big these returns are for 3 months. 

Remember, this is a continuation of November/December, which saw an approximately 20+% return in several of these indices.

A longer-term look at the S&P 500.

While we noted the numerous new all-time highs and expanding breadth above, we also want to show you the beautiful technical move that the S&P 500 index has made in the chart below:

In recent Market Outlooks we have pointed out that it is important (and necessary) for the soldiers (small-cap stocks) to begin to participate along with the generals (mega and large-cap stocks) that have been the major drivers of cap-weighted stock market indices in the past 18 months.

Finally, the IWM just made a 2-year high.  The question is, will this positive small-cap momentum continue with a clear and decisive breakout?  If so these types of stocks may explode much higher. 

This was something many of the analysts were forecasting and have been anxiously waiting for.  A further move would give proof that the BULL market will continue (more on that later).  See IWM chart below:

Volatility remains low.  The absence of fear is also helping to drive stock prices higher. Option pricing, which is directly tied to volatility, is not projecting much fear.  Therefore, market insurance/protection (puts) is low and with speculative option prices (calls) also low, this is attracting speculators to want to take positions.  Higher priced option positions (writing puts and calls) are not offering high credit premiums that would normally accompany a higher volatility market.  This is helping to pull money into outright long positions and help institutional investors rebalance portfolios to a higher allocation to equities than we might see in a fearful market.   See the volatility chart below:

Let’s examine the quarterly performance more closely:

Use the links below to continue reading about:

  • The biggest winning and losing stocks in 2024
  • The leading and lagging sectors in 2024
  • Why metals and commodities are likely to move higher
  • What to expect from stocks in April and for the remainder of the year
  • The weekly Big View bullets
  • Keith’s weekly video analysis
The market’s price action and news flow can be confusing and intimidating, but investing in this environment doesn’t have to be. If you would like personal guidance and hands-on management of your assets with the assistance of tactical, risk-managed, strategies, please contact me at donn@mgamllc.com or Keith at keith@mgamllc.com.

Why would the Fed cut their overnight lending rate?

Weekly Market Outlook
By Donn Goodman
March 27, 2023

Welcome back Market Outlook readers. Glad you could join us for this week’s Market Outlook.  Hope you enjoyed a profitable week of investing and trading in the positive market.

From the newsletter:

The Federal Reserve kept interest rates on hold.

After the Federal Reserve finished meeting for two days earlier last week, Chairman Powell announced that they would hold interest rates steady.  More importantly, he announced that the Fed remained cautiously optimistic that inflation is trending down as they stuck to the path for interest rate cuts to come later in the year.  The Chairman conveyed that price pressure will continue to ease, and it will likely be appropriate to start cutting later in 2024.

By a small majority, Federal Reserve committee members stuck to the expectation of three cuts for the remainder of the year.  Powell also indicated that slowing the pace of the reduction to the Fed’s bond holdings will come into view “fairly soon.”

Is this a change in posture?

No, but it does show that the Federal Reserve is likely willing to accept higher inflation than their long-held objective of getting inflation down to 2% for their long-term objective.  See the dot pattern below indicating 3 rate cuts during 2024:

One problem area of inflation is housing.

Housing costs remain a lingering inflationary concern and have challenged the Federal Reserve’s effort to curb rising prices. Fortunately, rents have shown signs of cooling, but we don’t think a steady downward trend has fully materialized yet.

Housing costs are an essential part of the economic backdrop.  Higher market rents erode consumer spending and have a negative impact on discretionary spending including retail sales, which remains a significant part of the economic engine.

Chairman Powell expressed confidence that lower market rents would eventually translate into lower housing inflation.  He did acknowledge uncertainty about the timing of this impact. He also stressed that any decision the Fed might make will be data dependent.  We are of the opinion that this data point may cause additional complications for the Fed’s action to lower rates.  We see these rate cuts potentially being pushed out further in the year and then being construed as a political, more than economic move.

See the most recent PCE (Personal Consumption Expenditure) chart below, which includes housing but not food and energy:

So Why Would The Federal Reserve Consider Lowering Rates in 2024. 

Don't Get The Weekly Newsletter? Join Here:

Market Gauge Full Outlook:

The Fed voted to hold the Fed Fund interest rates steady last week.  In fact, they are staying on the track of reducing the Fed Fund rates and a majority of Committee members voted to reduce rates 3 times during 2024. 

The Stock Market celebrated with the biggest positive returns in 2024 and the biggest one week since December, 2023. 

Why would the Fed cut their overnight lending rate? 

There are several important reasons that the Fed is willing to stay on track to reduce the Fed Funds rates from its current 5.25% – 5.50% to a target (based on the dot pattern) of 3 cuts down to 4.50% – 4.25%?  Even without a significant reduction below the current annualized rate of inflation of 3% or better, the Fed is inclined to reduce rates and probably sooner due to the following reasons:

  • Even if inflation climbed to 3.0% or more, the spread between short-term interest rates (1-5 years) at 4.6% and the rate of inflation is too wide. They would like to see short-term rates at or below the rate of inflation.  Otherwise, monetary policy is too restrictive and borrowing costs for businesses as and home buyers is punitive.
  • The Fed believes that the economy is decelerating (slowing down), and they would like to see interest rates less restrictive. While corporate earnings have been well above expectations, growing 3.5% or better since 3Q 2023, companies are beginning to conduct layoffs and gear up for a softening economy.  The Fed is aware of this and wants to provide easier credit for the economy.
  • If the Fed is going to normalize interest rate conditions, they need to do it long before the election in November so as not to look as if they are trying to interfere with the Election and any perceived advantage for one party over another.
  • The Fed understands that higher interest rates are a material drag on current government debt. Higher interest rates are now responsible for over $1 trillion in finance charges to the Government, exceeding the total defense budget.  This is unsustainable.
  • Interest rates need to come down to bring down the rates offered at the Treasury auctions. Treasury Secretary Yellen has indicated they will suspend some Treasury auctions until such time that interest rates come down as the finance rates on these auctions are egregious.

A big week for Central Banks around the world.

Many countries around the world also held central bank meetings over the last few weeks signaling their future plans on their monetary policy.

The Swiss National Bank, citing progress on inflation, became the first among global peers to cut interest rates.  Norway signaled no such move to lower rates for at least another 6 months.  As was expected, The Bank of Japan finally ended its negative interest rate regime (-0.25%) and raised rates to 0%.  This was a long time coming and a good sign that economic conditions have finally picked up in Japan.

In Africa, central banks in the continent’s biggest economies, including Egypt and Kenya, all maintained tight monetary policies to contend with lingering and sticky inflation.

Several other developed nations signaled optimism that their rate cuts were still on the table for later this year, similar to the United States stance.

The Fed’s Projections.

As referenced above, much of the Fed’s motivation for reducing the Fed Funds was that inflation would decline and economic conditions soften.  Their longer-term expectations were evident in the data that they put forth this past week.  See table below:

As mentioned above, it certainly seems that Powell & Company are willing to accept higher inflation (as referenced in the chart above) than previous targets.

Our take:  Both Mish and I have been suggesting that inflation wouldn’t come down so quickly.  While we both saw it trending down, we were not surprised that it started to pick up again in January and February when it unexpectedly came in “hotter” than expected.  Right now, we are having a hard time buying the idea that inflation gets to 2.4% with economic conditions as good as they currently are.

Not everyone is happy with possible rate cuts.

We have maintained “higher for longer” and will continue with this narrative.  Additionally, we are not surprised that some economists have NOT agreed with Chairman Powell’s assessment that rates should be reduced.  Former Treasury Secretary Lawrence Summers this week accused the Fed of having “itchy fingers” on rate cuts in the face of a stronger economy.

In summary:  We would NOT be surprised if the Fed went to 1 or 2 rate cuts and that they could be put off by a month or two than is currently expected.

Continued Concern:

For over a year we have laid out the lingering concerns from some economists that we are headed for a recession.  This has not materialized (yet), even though we have had the longest running inversion between 2-year and 10-year Treasuries.  In the past, this type of inversion has forecasted an oncoming recession. There are still plenty of market commentators who continue to stick with the recession narrative.  See chart below:

We have no idea if a recession in 2024 will ever materialize.  However, we remind you that in the past the Federal Reserve has cut rates more often from weak economic conditions. These were typically the result of slow or no growth or an economic contraction that was facing a recession.

Does the Federal Reserve know something that they are not telling us?

The Stock Market Surge.

Given the positive news from the Federal Reserve and no pushback from Chairman Powell, even with the recent climb higher from the CPI, PPI, and the PCE, Wall Street surged based on potential future rate cuts.  Why?

Lowering interest rates provides less drag on companies and investors as financing rates decline.  Long-term investors adjust their future cash flow rates to evaluate possible stock targets.  Additionally, earnings can begin to re-accelerate as consumers feel the “ease” from lower interest rates. Calculations on stock multiples can expand as the looser financial conditions take over.

Investors and traders celebrated the news of these possible rate cuts and the S&P 500 closed above 5200. This marked the 20th new high for the year on Thursday.

The MSCI global gauge of shares also climbed more than 2% for this past week while the S&P 500 closed up 2.3% for the week, putting in its best week since December.

According to Eric Sterner at Apollon Wealth, “The Goldilocks narrative is still very much in play with the Fed sticking to its projection for cuts while also raising economic growth forecasts.”

Not only did the S&P 500 establish a new high but stock markets around the world, including Japan, Hong Kong and across Europe closed on new highs as the global stock market rally (bull market) continues.

Could the Federal Reserve cut rates with the S&P at new fresh highs?  (it has happened more often than you might think-see chart below)

The Bull Market is Making History:  5 months, 28% and $10 Trillion.

Use the links below to continue reading about:

  • How many new All Time Highs the S&P 500 has had already in 2024?
  • What big cap stocks were the big winners last week (and which were the big losers)?
  • How many weeks the NASDAQ 100 (QQQ) has gone without as much as a 2% drop?
  • What sector of the market has doubled the S&P 500 and is still doing well?
  • What is the current average household allocation to stocks? (this might surprise you)
  • What the market is forecasting now that we are in an upcoming Election?
  • The Big View bullets
  • Keith’s weekly video analysis
  • And more!
The market’s price action and news flow can be confusing and intimidating, but investing in this environment doesn’t have to be. If you would like personal guidance and hands-on management of your assets with the assistance of tactical, risk-managed, strategies, please contact me at donn@mgamllc.com or Keith at keith@mgamllc.com.

The Race Between Semiconductors, Gold, and Cocoa Heats Up!

Weekly Market Outlook
By Donn Goodman
March 20, 2023

Fed Chairman Powell faces an increasingly difficult task of managing monetary policy without showing any bias towards either political party in the final months of the election year, but…

There is a much more intriguing race he must also focus on.

The inflationary race between Semiconductors, Gold, and Cocoa is heating up if not speeding out of control.

This race could be surprisingly important to you if you care about the buying power of your retirement savings!

Consider this…

If, at the turn of the millennium (Jan. 1, 2000), you were given “inside” information from the future that “Artificial Intelligence” would become a reality thanks to new developments in semiconductor technologies by the year 2025, and then asked to lock up your retirement savings in only one of the following three investment options.

What do you think you would have chosen?

  1. The Semiconductor Index. Using the “index” ensures your investment would survive over time like your other choices had…
  2. The metal that had first been used as a form of currency in 700 BC (Gold), or
  3. The seeds from the Theobroma cacao tree, which have been traded since 1500 BC and are currently used as a main ingredient in chocolate (Cocoa).

As you can see from the charts below, it’s a remarkable situation that appears to be getting more heated up with each passing week!

Don’t dismiss this situation as only applicable to well-positioned active investors skilled at managing risk.

This should grab the attention of every investor, even the most conservative, who may seemingly have no interest in trading gold, semiconductor stocks, or esoteric cocoa futures.

As you may already suspect, this week’s article isn’t just about higher prices for gold jewelry, your next purchase of a box of chocolates, or a fancy mocha latte.

It’s about a critical tipping point in interest rates that I’ve been discussing with members at MarketGauge over the last several weeks.

Long-Term Interest Rate Tipping Points

While most investors consider the level of interest rates to be the source of the “tipping points” that move stocks…

We’ve found that the velocity of interest rate changes is equally as reliable as absolute levels at identifying “tipping point” effects on other markets and trends such as stocks, gold, housing, currencies, the economy, etc.

The chart below shows how long-term interest rates, as measured by the TLT ETF, are sitting at a price level and rate of change, which historically has led to a tipping point for a significant move in both bonds and stocks.

Let’s begin with the pattern that has developed in the TLT over the last 2+ years around absolute levels.

The pattern annotated by the green arcs and dashed horizontal line at $93 is a simple technical reversal pattern with many different names.

It will likely be labeled by many as a head and shoulders bottom if it resolves itself to the upside by breaking above the impressive 6-point trend line and equally significant horizontal line at $100.

What’s not shown on this chart is that such a break higher would also take out a 200-day moving average and confirm a bullish momentum divergence pattern in our Real Motion indicator.

In short, a move over 100 in TLT could lead to a surprisingly big move higher in bonds, and LOWER in interest rates.

However, a pattern as coiled as this one has the potential to be equally as volatile if it “fails” or breaks down.

In fact, the “head and shoulders” pattern doesn’t completely exist until it moves higher, but this is a very clear inflection point pattern that we follow on any time frame at MarketGauge, and in this case…

The resolution of this pattern will likely have big implications for gold, technology stocks, the broader stock market, and, of course, interest rates.

So, to anticipate which way the pattern in TLT is likely to break, I looked into the velocity of the recent action in interest rates and a very timely and interesting leading indicator, which I’ve called “The DBA+DBE Inflation Index.”

The current condition of this indicator could have allowed me the creative license to title this week’s Market Outlook…

“Will A Drought In West Africa Crash What’s Left of The Magnificent 7?”

What follows is an interesting example of how and why “unsuspecting linkages and consequences” can surprise investors who don’t stay open-minded and listen to the wisdom of the crowd as shared through the patterns in the charts.

Click here to keep reading about:

  • Which way TLT may break based on the velocity in its chart pattern
  • Why the weather in West Africa and cocoa matters to the stock market
  • The Big View bullets
  • Keith’s weekly video market analysis.
  • And more
The market’s price action and news flow can be confusing and intimidating, but investing in this environment doesn’t have to be. If you would like personal guidance and hands-on management of your assets with the assistance of tactical, risk-managed, strategies, please contact me at donn@mgamllc.com or Keith at keith@mgamllc.com.

Sister Semiconductor Surges and Shines!

Weekly Market Outlook
By Donn Goodman
March 13, 2023

Welcome readers to our Weekly Market Outlook.  We thank you for “tuning in,” and of course, we appreciate all the comments we keep receiving. Keep them coming. Feel free to send them to me at DonnG@MarketGaugePro.com. Let’s jump right into the update:

There is a host of important issues pertaining to the Economy, the Markets and the major drivers, including technology and semiconductor stocks. 

The Bad News for the Economy.

Given much of the good news surrounding positive earnings surprises that we have witnessed during this recent earnings season coupled with steady job growth, companies want to ensure their margins are intact and have begun to cut staff.  We haven’t seen these type of job cuts since the pre-recession periods of the past. 

Is it that these companies wish to keep their profits intact or is there a bigger pivot occurring in today’s industries due directly to AI and technological breakthroughs these company’s are experiencing?

More on the Job Cuts:

Job cuts at U.S. companies in February reached their highest level since 2009, according to the monthly layoff report from Challenger, Gray & Christmas.

“Businesses are aggressively slashing costs and embracing technological innovation, actions that are significantly reshaping staffing needs,” Andrew Challenger, a labor and workplace expert at Challenger, said in the report.  See chart that follows below:

Employers primarily cited “restructuring” as the cause of the layoffs. An example of this can be seen in high profile tech layoffs at companies such as Google. The tech giant, and one of the vital components of the Magnificent 7 (more on this later), announced significant layoffs in January as part of their large-scale reshuffling, saying the company is shifting to “invest in our company’s biggest priorities”. A month earlier, the company launched its AI bot Gemini. We surmise that this new AI program is heavily powered by Nvidia semiconductor chips.

Other big tech companies such as Microsoft, Apple, Amazon and Meta have all announced cuts this year just as they look to ramp up their AI efforts.

Job cuts in tech are much lower than they were last year. In February of 2023, nearly one third of all job cuts came from tech companies. This year, other industries have begun to begin large job cuts. These industries, including manufacturing and energy, are incurring layoffs that are 1,000% more than were enacted during 2023. Below is a list of the industries and their projected job cuts for 2024:

This week, we also got testimony from Federal Reserve Chair Jerome Powell, who said that the Central Bank is getting close to the confidence level needed to start lowering rates. His comments reinforced the Fed’s new pivot from the chapter that began during the pandemic and was exacerbated by rising costs from Russia’s war on Ukraine.

Many investors had thought the Federal Reserve would start lowering rates this month, since the current inflation is around 3% and the 10-year bond yield is over 4%. We think the inflation challenge is not done yet, as the forecasts have changed for longer periods than 1 year ahead, and inflation expectations may still pose a long-term risk to the economy.

We think that this has kept the Fed in a more hawkish stance and that we will not see interest rate cuts until June or beyond. (we could be wrong). See chart below:

The Markets.

Earlier in the week, with the continued upward movement of technology stocks, it looked as if the S&P would close for the 17th positive week in 19 weeks. But such was not the case when the market turned down on Friday afternoon led by a selloff in the afternoon. See the 21-week chart on the S&P below.

Nvidia, which has been on a tear (along with other semiconductor stocks – more to follow on this), had a 10% move on Friday from peak to trough. See chart from Friday below:

However, all the major markets remain positive and healthy year-to-date. The strength of the returns since October 2023, has historically led to more gains going forward.

Use the links below to continue reading about:

  • What happens when the Stock Market is up over 20% in 18 weeks?
  • The long-term record of the S&P 500 since the Great Financial Crisis of 2008-2009?
  • Sister Semiconductor: The Major Driver of the Markets!
  • The longest streak for semiconductor stocks since August 1995
  • What happens after this kind of streak?
  • What investors are doing with Tech stocks now?
  • The Magnificent 7 has become the Fabulous 4
  • Gold is beginning to Shine!
  • The Big View bullets
  • Keith’s weekly video analysis
  • And more!
The market’s price action and news flow can be confusing and intimidating, but investing in this environment doesn’t have to be. If you would like personal guidance and hands-on management of your assets with the assistance of tactical, risk-managed, strategies, please contact me at donn@mgamllc.com or Keith at keith@mgamllc.com.

The Bull Keeps Running. What Does The Strength Over the Last 60 to 120 Days Mean?

Weekly Market Outlook
By Donn Goodman
March 06, 2023

Welcome back to our weekly update and Market Outlook. Glad you are here and happy to share some insights about the market, the economy, and what the future may hold.

It is a good time to be an investor in almost any market (as shown below).

The frenzy that continues around AI (artificial intelligence) has propelled this market higher. More importantly, most of the analysts that are covering AI and technology stocks continue to believe we are in the early innings of a multi-year revolution in productivity and company profitability. This emerging technology has blindsided Wall Street forecasters.

In the past week alone, Piper Sandler, UBS and Barclays have all boosted their S&P 500 Index targets, which is up 7% to start the year. Two firms, Goldman Sachs and UBS have lifted their targets twice since December. Jonathan Golub, UBS Investment Bank Chief US Equity Strategies, said, “I’ve been doing the strategy job for about 20 years, and this is the first time I have ever done something like that”. His recent second revision to his 2024 target was raised to 5400 and tied him with Ed Yardeni of Yardeni Research who had been the highest among 25 strategists tracked by Bloomberg.

Last week the US PCE (Personal Consumption Expenditures) data was released. There was no nasty surprise, and the S&P notched its 14th record close on Thursday and then its 15th record close on Friday.

Even with this week’s pullback, it is a good time to be invested in just about every market. See illustration below:

A positive four months.

Since November we have been providing charts and graphs in this weekly report that indicated a positive bias.  Many of these charts show what might occur when buying stocks at new all-time highs.  Past statistics are significant in showing that the positive bias has been continuing.  Remember two important things.  The market can and will go much higher than rational expectations and many investors (including the millions that hold 401k plan assets) won’t commit money until the markets have gone up for a while and they finally get sucked in from FOMO (fear of missing out). 

In the last few months, we have published chart after chart encouraging our readers to feel more confident about putting their investment capital to work in the markets.  (PLEASE go back through the archives and read the Weekly Outlooks from December 2023 to recent).  A recent chart from an early February Market Outlook is below:

While human instinct would say to be cautious after a lengthy and profitable run, there is historical evidence suggesting that investors can confidently buy a market especially when it hits new ALL-TIME HIGHS.  See the chart below that we included in a Market Outlook about 5 weeks ago:

And don’t forget the chart we shared with you right after Valentine’s Day:

It has been a great run since November 2022.  To review how far we have come since the bear market of 2022, we provide the following recap:

Clearly the past 16 months has been a positive investment period. This bull market keeps on running and may be far from being done (as illustrated in the above charts).

The big winner from the stock markets cited above is of course TECHNOLOGY stocks. The whole AI scenario began in earnest back in late 2022 and has driven many of the gains that we have seen in the NASDAQ.

From November 2023 to the end of February (Thursday of this past week as we experienced a once in four-year extra day of trading), here are the returns of those same stock market indices:

Again, you will note the big winners have been the QQQ’s (technology stocks) driving plenty of the overall returns.  HOWEVER, we are beginning to see a broadening out with the past two months showing increasing NEW 52-week highs and fewer 52-week lows. 

How is your portfolio doing?  We would be pleased to help you evaluate how your current portfolio is doing comparatively.  We will also be happy to compare that to our All-Weather portfolio blends.  You might be surprised how much better you could do with active management.  If you would like some information or want to discuss your current portfolio, please reach out to Rob Quinn at Rob@MarketGauge.com. Or myself, DonnG@MarketGaugePro.com

You may be pleasantly surprised to know that we also offer a high-income blend (Trilogy) that incorporates asset management from two outside superior performing money managers.  Over the last 5 years fixed income has not produced any gains (after dividend distributions) and our blends have been well above 5% per year (and 11% last year). 

Click the links below to continue reading about:

  • The Magnificent 7 Stocks
  • Sector rotation
  • Small caps
  • The historical implications of the strength of the last 60 – 120 days
  • The BigView bullets
  • Keith’s weekly video analysis
The market’s price action and news flow can be confusing and intimidating, but investing in this environment doesn’t have to be. If you would like personal guidance and hands-on management of your assets with the assistance of tactical, risk-managed, strategies, please contact me at donn@mgamllc.com or Keith at keith@mgamllc.com.

Rocket Stock. Changing History? What 3 or 4 Good Months in Row Means?

Weekly Market Outlook
By Donn Goodman
February 28, 2023

Welcome Market Outlook readers. Happy late February. We are getting closer to the start of Spring and warmer weather. Hope you had a good and profitable week. Did you hang on to your Nvidia stock if you had any?

I couldn’t help but think about one of my favorite all time songs by Elton John, “Rocket Man” with a slight change in lyrics. Indulge me for a minute:

The Market packed my bags Wednesday, pre-flight.
Zero hour 4:00 p,m.
And I am gonna go high as a kite after then
I miss normal price earnings so much, I miss flat line
It’s lonely out in new high skies
On such a timeless flight

And I think it’s gonna be a long, long time.
Til touchdown brings me ‘round again to find
I’m not the stock they think I am,
Oh, no,no,no
I’m a rocket stock
Rallying out my valuation up here alone….

You may already be quite familiar with the Nvidia saga and perhaps, hopefully, you have been one of the many who have greatly benefited from this profitable trip to new space and new highs!

Nvidia shares surged Wednesday night after it reported blowout results that cemented Wall Street bets on the potential for its artificial intelligence technologies. The chipmaker also gave guidance well above future expectations, driven by AI spending at its biggest customers, including among many, Microsoft and Meta.

“The company is printing money at this point,” said Stacy Rasgon, an analyst at Sanford C. Bernstein. “And the prospect for continued growth from here still seems solid.”

Nvidia had been in pause or correction mode the prior 4 days down -8.7% before posting earnings and blowing away every analyst’s projection. Immediately after reporting earnings around 4:05 p.m. eastern time on Wednesday, the company’s stock rocketed higher up 9% in pre-market activity.

This trajectory continued Thursday, and the price of Nvidia stock ended the day up 16%, adding $277 billion in market capitalization and bringing the company close to a $2 trillion valuation. That addition eclipsed the $197 billion gain made by Facebook at the start of the month. It was the largest one-day historical gains in market valuations, we provide the following illustration below:

Thankfully, the release of spectacular earnings for Nvidia assured the market that the AI mania is still going strong. It also helped to make the stock price look cheaper. The bulls have now computed the stock’s new price-to-earnings ratio, or how much investors are paying for the future growth of the company’s revenue and if margins can stay astronomically high.

“Some investors have been scared to buy because they think the stock is too expensive, but that has been a huge mistake,” said James Demmert, chief investment officer at Main Street Research. “Every time it reports, the P/E shrinks because the E ends up being so much stronger than people expect,” Demmert went on to say. Our view is that with competition the margins will eventually decline over the next few years, and that will have a dampening effect on the stock’s price.

Perhaps more importantly, the NASDAQ 100 (QQQ) had been breaking down prior to Thursday’s market opening. It looked realistic that we could go into correction mode on tech stocks when Nvidia rescued the trend, turned things around, and got one of the largest one-day NASDAQ moves (up 3%). See charts below:

Wednesday’s close before Nvdia reported. QQQ looked weak.

One day later and then this happened (see chart below):

In the meantime, investor interest in Nvidia remains frenzied. While some have speculated that its success might be a bubble, most Wall Street analysts say its financial statements have been proof the product is viable. “Additionally, the growth of their core data center business is genuinely stunning”, Goldman Sachs Tony Pasquariello wrote in a note to clients Friday.

Because it is now so much more valuable, Nvidia’s financial results carry greater weight for the overall stock market, namely the S&P 500 index. According to Agati, the Chief Investment Officer of PNC Financial Services, 60% of the earnings growth among all S&P 500 companies for the most recent quarter came from Nvidia alone.

In other words, for the moment, as Nvidia goes, so goes the market. This is a positive for consumers who hold investments in the stock market whether individually, or through their retirement accounts. For now, “Nvidia has become critical to the market’s path forward,” Agati said in an email to NBC News, adding “In the saying ‘data is the new oil’, Nvidia continues to prove it is in a league of its own”.

Semiconductors continue to move upward.

As most of you are aware, MarketGauge was an early pioneer in developing formulaic, quant based (algorithmic) investment strategies that are built on proprietary technology. These algo formulas emulate any of the trading patterns learned by Keith, Geoff and Mish on the floor of the commodity exchanges and then trading for one of the world’s largest hedge funds (at that time).

It continues to surprise me that our Algos uncover investment ideas that frankly I don’t always agree with. MOST of the time, they are correct, and I am wrong. Many times, over the past few years (especially 2020 pre-covid) these Algos got out of the market and ever since have often been investing earlier than a market’s initial move up. (April 2020 and October 2023 are two such examples)

Yes, we rode Nvidia quite a long time in a few of our strategies just like we did in Tesla, Meta, the homebuilders and even travel cruise company Royal Caribbean. Interestingly we are still invested in several of these names or sectors through stocks or ETFs.

If you would like to know which ones or how we are currently positioned, reach out to Rob Quinn at Rob@MarketGauge.com.

Use the links below to continue reading about:

  • The trend in semiconductors
  • Nvidia’s next chapter
  • The market’s high concentration in large caps
  • A condition that has a 25-0 record for future bullish markets
  • The Big View bullets
  • Keith’s weekly video analysis
The market’s price action and news flow can be confusing and intimidating, but investing in this environment doesn’t have to be. If you would like personal guidance and hands-on management of your assets with the assistance of tactical, risk-managed, strategies, please contact me at donn@mgamllc.com or Keith at keith@mgamllc.com.

Persistent Inflation Troubles The Markets What Does the Valentine Indicator Predict?

Weekly Market Outlook
By Donn Goodman
February 21, 2023

Welcome Market Outlook readers. Last week’s market action was a lot like the action at the Super Bowl the Sunday prior. It was a nail biter at the end. Whether it is a football game or investing, it is always about the “little things” that make the difference. Critical game plans and strategies always factor in. It reminds me of successful investing and trading. For us, it replicates how and why our quant models work. It’s always the small things that make the biggest difference like taking off profits and/or utilizing stops.

Higher for longer.

If you are a frequent reader of this weekly Market Outlook along with Mish’s Daily, you know that we have both been suggesting that inflation would likely tick up after the past few month’s plunge lower. This would likely mean interest rates could possibly go back up (they fell much too fast). We have both often stated that what investors expect will happen in a given time, rarely works out that way.

This was the case this past week. Tuesday morning (Feb 13) the CPI was released and was “hotter” than expected. As we saw in the 1970s, driving inflation down is tricky. Seldom, if ever, do economic actions result in smooth lines. We both said this towards the end of the year. My message was clear in December: volatility and higher risk would likely be more prevalent in 2024. This past week was an accurate demonstration of just that.

Peak inflation is likely behind us.

Last week the CPI (Consumer Price Index) and the PPI (Producer Price Index) inflation reports confirmed that inflation continues to decline. However, expectations were for a much bigger drop in the CPI year-over-year number from 3.4% to 2.9%. Instead, the CPI surprised to the upside with a 3.1% year-over-year print on the headline number. The monthly number was 0.3% versus the expected 0.2%. Rent prices have stayed stubbornly high and had a material impact on the monthly number.

Other analysts were quick to point out that January is a seasonal period and prone to a higher monthly number. That may or may not be true, but it offers a good explanation especially for TV market shows.

Given oil prices rising (and gasoline at the pump), grocery/food prices staying high, and other areas of the economy not slowing as expected, persistent inflation may be hard to knock down.

However, core CPI (ex-food and energy) is currently at 3.9% y/y and down significantly from last summer’s high of 6.6%. See chart below:

Core PPI (wholesale inflation) is at 2.0 y/y, also down from last year’s summer peak of 8.2%. So, the needle is moving more toward the green.

The latest Personal Consumption Expenditure (PCE) index (the Fed’s preferred inflation gauge) showed inflation at 3.2% y/y, down from last year’s peak of 5.3%

While it may be true that these inflation indicators ticked up due to a seasonal bias, the fact remains that we are a long way from the Fed’s targeted 2.0% inflation rate. Inflation, as we have pointed out on many occasions, will be hard to bring down to the Fed’s target rate. See the illustration below:

Most of you are aware that the higher CPI number threw a monkey wrench into the markets on Tuesday, as we had the single biggest one-day decline since last March 2023. More importantly, interest rates continued rising this past week.

Rising interest rates typically have an impact on risk assets (as they did Tuesday) but thanks to the better-than-expected earnings reports that have been delivered these past few weeks during earnings season, the market’s resiliency has held up. Following the big decline on Tuesday, the markets moved higher on Wednesday and Thursday until Friday’s PPI report led to a down day to end the week.

See the illustration below of the recent move higher in the 10-year interest rates.

While it’s true that the recent CPI and PPI reports showed inflation falling a little bit less than expected, it’s not likely to alter the Fed’s thinking on rate cuts.

Those sentiments were echoed earlier this week by Austan Goolsbee, the President and CEO of the Federal Reserve Bank of Chicago, when he said what many in the market were already thinking, which is,

"Let's not get amped up on one month of CPI that was higher than it was expected to be." He continued by saying, "if you see inflation up a little bit, that doesn't mean that we're not on the target to get to 2%. We can still be on the path even if we have some increase and some ups and downs --- so let's not get too flipped out."

Last November, investors interpreted the Fed’s more dovish posture and immediately factored in as many as 6 rate cuts. We did not buy it. (we still don’t unless there is a major economic collapse). GDP growth is projected to stay positive during 2024. This would be consistent with the economic patterns that are typical in the 4th year of a Presidential cycle and especially during an election year. This would also mean that the US might possibly avert the dreaded Recession that many bond managers have been calling for (see Gundlach and Gross).

Additionally, earnings are growing at a higher rate than all the analysts’ and street’s expectations. This should be a positive contribution to bullish sentiment for stocks in 2024.

The interest rate projection for Fed rate cuts was recently altered after the January and February CPI/PPI releases. Most investors are now factoring in no more than 4 rate cuts and not beginning until June.

We would suggest that the Fed is between a rock and a hard place. If they are going to reduce the overnight Fed Funds rate, they probably should do it before June/July. The summer begins the Election cycle which includes the Political (DNC and RNC) conventions. I believe the Fed will try to refrain from the perception that it is meddling with the upcoming election.

See the below commentary and graph that follows the % probabilities of the Fed lowering rates:

It’s official, higher for longer is back: For the first time this year, markets are now pricing-in just 4 interest rate cuts in 2024. Just 6 weeks ago, markets were expecting 6 interest rate cuts in 2024. More importantly, the timing of the first rate cut has been pushed all the way back to June 2024. There is now only a 9% chance of rate cuts beginning in March 2024, down from 90% just 6 weeks ago. There is also a ~63% chance that interest rates are unchanged through May 2024. Rate cuts are all but guaranteed.

The Stock Market

Use the links below to continue reading about:

  • Use the links below to continue reading about:
  • Insight into the many ways in which the stock market digested last week’s news
  • Record breaking market concentration metrics
  • The bullish Valentine Indicator
  • The broadening out of the bull market
  • Sector rotation
  • The Big View bullets
  • Keith’s weekly video analysis
  • And more!
The market’s price action and news flow can be confusing and intimidating, but investing in this environment doesn’t have to be. If you would like personal guidance and hands-on management of your assets with the assistance of tactical, risk-managed, strategies, please contact me at donn@mgamllc.com or Keith at keith@mgamllc.com.

What the Chiefs and Technology Stocks Have in Common! TWO SUPER CELEBRATIONS.

Weekly Market Outlook
By Donn Goodman
February 14, 2023

We welcome you to another weekly Market Outlook.  Thanks for being here.

Let’s talk about the really important things now, NEW HIGHS on the S&P 500 index.

Yesterday, the S&P 500 index finished above 5,000 for the first time.  We have written several times in recent Market Outlook columns (click here for last week’s column) that the stock market (and individual stocks) like round numbers.  They are pulled both up (and down in bad markets) to hit round numbers.  It is no surprise that the S&P was “pulled” up to 5,000 and beyond.  As we have pointed out in the past few weeks, we had expected it. 

Just as important, the S&P 500 is up 14 of the past 15 weeks, which has not been done since 1972.   See charts below:

Investors continue to bet on a “soft landing” and a resilient US economy given low unemployment, inflation having come down over the past year and the Federal Reserve’s forecast of several rate cuts during 2024.  A positive recent takeaway is that FOOD prices are beginning to come down.  This should help ease the burden of the average family having difficulties providing quality food for their families, something we often hear from consumers and surveys about “what is worrying the average worker.”    See chart below:

The good news for the economy is that wages have been rising and that shows up in the following chart illustrating that the average consumer keeps spending $:

  • Despite the 5,000-point milestone, there’s caution that the S&P 500’s 20% rally since early November may hit a roadblock soon. (more on this in a minute).

    The Fed kept its main interest rate at a 22-year high for a fourth straight meeting last week, and while officials signaled their openness to cutting them eventually, it won’t happen right away.

    “The big driver for the rally is the realization that the US economy is unlikely to falter in the way that the average prognosticator had expected,” said Yung-Yu Ma, chief investment officer at BMO Wealth Management. “A better economy, healthy profits, and lower inflation are providing the fuel.”

    Continued strength in the S&P 500 is making history.

    • The S&P 500 closed at a fresh record high this week, gaining +1.37%. It’s only had one negative week since the October lows, rising +22% in that time.
    • This was the fifth straight weekly gain of +1% or more. Since 1950, there have only been 11 other five-week streaks of +1% or more.
    • The S&P 500 generally continued higher over the next few months, although 1956 and 1987 were notable exceptions.

    Additional facts and figures on the S&P 500: (more on several of these shortly)

    First Impressions Matter. In the 40 years since WWII when the S&P 500 was up at least 1.5% in January, its median performance for the remainder of the year was a gain of 13.4% with positive returns 82.5% of the time. In all other years, the S&P 500’s median gain was 5.7% with positive returns 66.7% of the time. (Source: Bespoke)

    Lights Out. The Technology sector’s weighting in the S&P 500 ticked above 30% on 1/24 for the first time since 9/26/00. On the same day, the Utilities sector saw its weighting in the S&P 500 drop to a multi-decade low of 2.17%. Since 1990, the only time the Utilities sector’s weighting dipped below that level was in late March 2000 at the peak of the Dot Com Bubble. (Source: Bloomberg)

    Does Share Price Matter? In the large-cap Russell 1,000, the 100 stocks that began 2024 with the lowest share prices fell an average of 7.4% in January, while the 100 stocks with the highest share prices rose an average of 2.0%.  Additionally, the 41 Russell 1,000 stocks that began the year with a $500+ share price rose 3.2% in January, while the 25 sub-$10 stocks fell 11.0%. (Source: Bespoke)

    No Breaks. The S&P 500 has now rallied 21.3% over the last 70 trading days without experiencing even a 2% decline from a closing high. Since 1953, there have been 15 other streaks where the index went at least 70 trading days without a 2% decline. One year after those prior 70 trading day periods, the S&P 500 was up an average of 12.7% with gains 87% of the time. (Source: Bespoke)

    Earnings Beats are Rallying. 72% of the more than 500 companies that had reported Q4 2023 earnings through February 7th reported stronger than expected EPS compared to a historical EPS “beat” rate of 65% over the last ten years. Stocks that beat EPS estimates have rallied more than 2% on the first trading day following their earnings reports this season, or about 50 basis points more than normal. (Source: Bespoke)

The takeaway: The current rally is beginning to challenge historical extremes, but as the legendary technician Paul Montgomery once said, “The most bullish thing the market can do is go up.”

What happens next?

Use the links below to continue reading about:

  • What happens the next six months after the market hits new highs?
  • Which sectors of the S&P are currently the strongest?
  • Why Technology is by far the strongest sector.
  • What are the biggest winners in technology?
  • Communications stocks are a close second.
  • Keith’s weekly BigView video analysis
The market’s price action and news flow can be confusing and intimidating, but investing in this environment doesn’t have to be. If you would like personal guidance and hands-on management of your assets with the assistance of tactical, risk-managed, strategies, please contact me at donn@mgamllc.com or Keith at keith@mgamllc.com.

Is It A Good Time To Put More $ In The Market?

Weekly Market Outlook
By Donn Goodman
February 07, 2023

Welcome readers.  We hope you had a profitable and productive last week of January and first few days of February.

The End of the Month Period.

The end of the month is a uniquely favorable period for investing.  A number of factors contribute to this, including 401k contributions getting invested, companies typically buying back their stock towards the latter part of the month, pension funds rebalancing their asset allocations, and some individuals having auto investment plans. 

Combine end of month favorability and the continuation of a bull market that blasted off at the beginning of November when the Federal Reserve broadcasted upcoming rate cuts, and it is no surprise that the market remains in party mode. 

It is also earnings season (more on this shortly).  Couple the favorable positive seasonality with blowout earnings from several of the largest tech companies, and you have the recipe for the party to extend further.  But will it continue?  We will explore a few charts and commentary about the upcoming (election) year and what the current earnings season and market pricing may hold going forward.

Therefore, it is no surprise that the end of January and the beginning of February have, so far, been positive. 

Did you know that MarketGauge utilizes a strategy that invests only 32% of the time in the markets and takes advantage of calendar and seasonally positive periods?  This strategy has a back-tested and partially real-time track record with over 8.5% a year return for 6 years with minimal drawdowns.

We also recently received a positive signal from one of our other investment strategies, Profit Navigator, and entered the market with a partial position.  The unlevered strategy has back-tested at over 17% a year with drawdowns of less than 40% of the S&P 500.  The levered strategy interestingly enough has back-tested at over 32% per year with drawdowns slightly less than just investing in the S&P 500.

If you would like more information on these strategies or how we can put them to work for you, please contact Rob@marketgauge.com or set up a free strategy call at www.marketgauge.com/call.

Two important economic inputs this past week.

 On Wednesday, the Federal Reserve Chairman, Jerome Powell, told the markets that there would be no change to interest rates, which fell in line with economists’ and market watchers’ predictions.  He also stated that it was unlikely that the Fed would lower rates in March.  That took some investors by surprise and resulted in an immediate sell-off which reversed course by day’s end and had little negative influence the remainder of the week.

The Federal Reserve continues to aim for the proverbial 2% inflation rate.  As we showed in last week’s Market Outlook (if you have not had a chance to review it, click here), inflation has come down at a rapid rate.  One of the reasons for inflation falling so fast is that the supply chain has been “fixed” and commodity prices have plunged.  A good illustration of this is the following chart:

Global commodity prices rose marginally for the first time in 9 months at the start of 2024 but reported supply shortages remain below long-run averages.  We think the Fed was acutely aware of this back in the fall when they announced several interest rate cuts in 2024.

The Fed’s Pause

As we stated above, the Fed’s pause was not a surprise.  December payrolls added 216,000, and the CPI, which measures inflation, came in at an annualized rate of 3.4%, well above the 2% target rate.  Then, on Friday, the jobs report was SHOCKING with an announcement that came in at 8:30 a.m. (before the market opened) with 353,000 new jobs added in January.  This was over 2x the expectations given that ADP announced their household report of only 107,000 new jobs earlier in the week.  The unemployment rate declined to 3.7% from an expected rate of 3.8%. Interest rates, which had been slowly coming down, reversed course and ended the day over 4% for the 10-year Treasury.

Who to believe?  We are not sure that the Bureau of Labor Statistics report of 353,000 could be accurate given that the ADP report was actually obtaining accurate information from households. Many believe the ADP report more accurately reflects the job market.  Also, the 353k number could include people who are working multiple jobs and being counted several times. 

The positive number that was released on Friday (and may have been the silver lining) was the Employment Cost Index, which only increased to 0.9% and shows that labor costs are slowing dramatically.  This number suggests that employers are feeling less pressure to raise pay to attract and retain workers as wage growth slowed in the 4th quarter of 2023.  These numbers show a possible reacceleration of the economy. 

Conclusion on interest rates:  Last year, in this column, we commented frequently that we believed interest rates would stay higher for longer.  Now we continue to believe that the economy is not showing nearly enough signs of weakness to warrant the Fed to lower interest rates until later in the year.

We also remain concerned that inflation may reaccelerate, especially given the turbulence in the Middle East and the effect it could have on the price of oil.  The market has adjusted its expectations to only a 20% chance that we could see a March rate cut.  While June remains at a 60% chance, we wouldn’t be surprised, given the strength in the economy, if that rate cut is also pushed off a few months. 

However, another point of view worth considering is that the Fed may wish to help the current administration get reelected (or feel the pressure to do so). There may be a high probability that they are going to cut rates mid-year to create easier financial conditions going into the election.

The Market Party lives on.

  • The S&P 500 closed at an all-time high for the third consecutive week and is now less than 1% away from hitting 5,000 for the first time.
  • Since the October low, the S&P 500 has closed higher in 13 of the past 14 weeks, gaining 20.4%. See chart below:
  • There have only been seven other instances where the S&P 500 surged +20% over 14 weeks and then closed at a record high. Every one of these instances, the S&P 500 has been LOWER one month later, averaging a loss of -2.18%. 
  • Those pullbacks may have been good places to buy as 85% of the time, the S&P 500 was almost always higher three months later (6 out of 7 times). The chart illustrating this is below:

Is it a good time to put capital to work in the stock market?

Friends and clients always ask this question.  It is a good one.  Up above, we showed that after hitting a new all-time high after 14 weeks (and a 20% gain) the markets were lower 4 weeks later.  This may or may not happen this time. 

Statistics point out that investing in the market after it hits a new all-time high tends to reap further gains.  Additionally, investing after a positive January has good follow-thru potential. 

At MarketGauge, we offer subscribers and asset management clients various investment strategies and blends that incorporate different market-beating investment edges.  Even if it were not the best time to get invested, our strategies are intended to help minimize risk and rotate into more favorable areas of the market.

All of our strategies utilize disciplined risk management and if you follow our guidance, the instructions will help mitigate potential drawdowns if they were to occur.  Also, it is important to know that it is not a stock market but a market of stocks (and ETFs) and proper rotation and risk management have historically produced positive returns even in unfavorable periods like 2022.  So what might these strategies do in a good market?  Reach out to Rob@marketgauge.com or www.marketgauge.com/call, and he can share the historical track records and additional evidence with you. 

We want to illustrate a few of these concepts for you so that you can decide for yourself if you should put more capital to work.

Investing when the market hits an all-time high has demonstrated better returns.  See chart below:

Use the links below to continue reading about:

  • What happens after the first-rate cut
  • 20 measures of market valuation
  • Several January-based indicators
  • A current condition that has occurred 9 times since 1952 and has a 100% track record in predicting the S&P 500 will end 2024 higher than today’s prices with an average annual gain of 15%.
  • The MarketGauge BigView Bullets
  • Keith’s weekly BigView video analysis

And more!

The market’s price action and news flow can be confusing and intimidating, but investing in this environment doesn’t have to be. If you would like personal guidance and hands-on management of your assets with the assistance of tactical, risk-managed, strategies, please contact me at donn@mgamllc.com or Keith at keith@mgamllc.com.

Unchartered Territory And Then There Were 6!

Weekly Market Outlook
By Donn Goodman
January 31, 2023

We welcome you to another weekly Market Outlook. Thanks for being here.

This past week’s economic data pushed stocks into unchartered territory. First, the 4th quarter GDP came out above consensus at a blistering 3.3% pace. (It recorded 2.9% for full-year GDP). PCE (Personal Consumption Expenditures) came in as expected, but year over year was at 2.9%. Below the expected 3%.

However, digging deeper into the recently released much stronger-than-expected Q4 GDP report, you’ll find a bonus in the core PCE Deflator data. The PCE Deflator rose at an annualized rate of 2.0%. By this measure, the Fed’s 2% inflation target has been achieved—for the second quarter in a row. See chart below.

One of the bright spots of the recent economic reports, including the CPI and PCE, is that sky-high rents have come down at a brisk pace. See rent chart below:

This harkens back to the beginning of November. The economic numbers then also came out showing favorable inflation cooling. You will recall that the Federal Reserve pivoted off their hawkish sentiment, and immediately, the market rocketed higher. The S&P has been up 12 of the past 13 weeks. See chart below:

Looking back to the beginning of 2024.

It seems like yesterday when we were welcoming in the New Year and beginning the process of prognosticating what might occur in 2024.  Surprisingly, the markets started off weak for the first week of the New Year.  But since then, it has been moving up almost daily.

So far in January, the S&P 500 (SPY) is up 2.55%, which would be annualized at 33.2%.  The NASDAQ 100 (QQQ) is up 3.49%, which would be annualized at 44.5%, the Dow Jones Industrial Average (DIA) is up 1.12%, which is an annualized rate of 14.6%, and the Russell 2000 Small-Cap Index (IWM) is down -2.36% which would be an annualized rate of -30.74. 

Take note of two important facts about the performance numbers above.  If the positive markets (SPY & QQQ) were to continue at this pace, the 2024 returns would surpass last year for the S&P 500 and come close to matching the NASDAQ 100 for all of last year.  Secondly, the more undervalued areas of the market (including small and mid-cap stocks that typically have faster growing companies), would be negative on the year.

This is likely NOT going to happen and one should not use the January returns as an indication of what will occur for the remainder of the year.  (please go back to the early 2024 Market Outlooks and read what historically happens for a better perspective)

If you are a follower of MarketGauge and get a chance to join Keith, Mish, or Geoff’s coaching sessions and webinars, you are aware that the January “Calendar Range,” which was completed on January 16th, can set the tone and define inflection points for the rest of the year. For more information on the January Calendar Range see Mish and Geoff’s recent video for StockCharts.

As we noted last week, it was no surprise that the first week of the year showed market weakness, given the positive and robust October and November with outsized gains.  Investors wanted to take some profits but were waiting to push those off until the 2025 income tax period. 

If you have not had a chance yet to read last week’s Market Outlook, you can click here to be taken to that article.  

Looking at New All-Time Highs in the S&P 500

The S&P 500 also closed at record all-time highs (ATH) for the 6th consecutive day on Thursday, making this the longest streak of record highs since November 2021.

Regarding the record new ATH of the S&P 500 Wednesday evening, Ryan Detrick of the Carson Group pointed out how rare these truly are.  See his commentary below: 

We have provided a history below of how many ATH have been recorded each year looking back to 1929. Please note the many years with 0 (zero) new All Time Highs and other periods where we many successive years with no new ATH for a considerable and extended period of time.

When price is in uncharted territory like this, technicians and analysts often use Fibonacci extensions to establish potential resistance levels or targets.

Analyst Ian McMillan points out that the 161.8% extension of the 2022 decline is between 5,400 and 5,600 which is a move of 10% higher from here. The question is “will it move in a straight line”? To which Ian answered, “I highly doubt it, but it is a target nonetheless.” See chart below:

A look at few of the key sectors that are driving the capitalization weighted indices:

Technology. The Technology sector, with its many mega caps stocks, continues the impressive move higher. Recently, as the chart below shows, technology became a 30% weighting of the S&P 500 Index. The last time we saw this was in 2000. That was about the time when the sharp correction in Tech stocks began and lasted until 2022. Technology’s influence on the S&P 500 performance cannot be underestimated.

Within the technology sector, semiconductor stocks are also on a blistering growth phase and have entered unchartered territory.

Use the link below to continue reading about:

  • The influence of the semiconductor sector on the economy
  • The strength of the financial sectors
  • The Magnificent 7 drops to 6
  • The weekly BigView bullets
  • Keith’s weekly BigView video analysis
The market’s price action and news flow can be confusing and intimidating, but investing in this environment doesn’t have to be. If you would like personal guidance and hands-on management of your assets with the assistance of tactical, risk-managed, strategies, please contact me at donn@mgamllc.com or Keith at keith@mgamllc.com.

Spicy Bahamian Seafood Recipes for a terrific Island-Inspired Feast

Delicious Bahamian Seafood Recipes

Turn up the heat with some spicy ingredients. Each recipe serves 4.

When we cruised the Bahamas, I was struck by the high quality and delicate flavor of the fish and shellfish, both at restaurants and at beach shacks. Simple fish soups were piquant with surprising finesse, as were the stuffed crab and grilled and fried seafood. I finally figured out that the combination of very fresh fish and shellfish, balanced seasoning, and minimal cooking are the secret. Don’t be afraid of the hot peppers—they become mellow when heated. Here are a few of my favorite Bahamian seafood recipes to try.   

Subscribe For Weekly Updates

Bahamian Stuffed Crab

1 cup chopped onions

4 Tbsp. butter

½ cup celery, minced

½ cup sweet pepper, minced

¼ cup parsley chopped (or 1 Tbsp. dried parsley)

2 lbs. cooked crabmeat

1 Tbsp. Creole seasoning (jarred or see recipe below) 

2 eggs

1 cup breadcrumbs

On medium heat, sauté onions in butter for 5 minutes. Add celery, peppers, parsley, crabmeat, and seasoning, and cook for 2 minutes more. Cool mixture for 10 minutes, then add eggs and breadcrumbs. Stuff mixture into crab shells (or individual ramekins). Bake* at 350 degrees Fahrenheit for 30 minutes.

*or grill on medium for 30 minutes

Creole Seasoning

5 Tbsp. paprika

3 Tbsp. salt

2 Tbsp. each onion powder and garlic powder

1 Tbsp. dried thyme

2 Tbsp. each dried oregano and basil

2 Tbsp. pepper

1 Tbsp. cayenne pepper

Combine all ingredients and store in sealed container.

Abacos Fish Soup

4 cups water

3 cups potatoes, peeled and diced 

1 cup onion, diced

4 slices of bacon, diced

½ tsp. each salt and pepper

2 small hot peppers (fresh or pickled), minced

½ cup carrots, sliced

½ cup celery, sliced

1½ lb. white boneless fish fillets, cubed 

In a large saucepan, bring the water to a boil and add the potatoes, onion, bacon, salt, pepper, hot peppers, celery, and carrot, until the potatoes are fork-tender, then add fish. Reduce the heat and simmer 3-5 minutes until the fish is just cooked and the soup is delicately flavored.  

Nassau Fish Cutlets With Devil’s Sauce

2 lbs. thin, boneless fish fillets

1 Tbsp. hot peppers (pickled or fresh), minced

2 Tbsp. lime juice

1 tsp. salt

4 Tbsp. oil or butter 

4 Tbsp. flour

2 eggs, beaten

1 cup cracker meal, breadcrumbs, or Panko

Place fish in a resealable plastic bag along with hot peppers, lime juice, and salt. Marinate for 30 minutes. Heat oil or butter in a frying pan. Dip fish in flour, then egg, then cracker meal. Sauté fish in hot oil or butter until golden-brown (2-3 minutes per side). Serve with Devil’s Sauce (recipe below).

Devil’s Sauce 

2 Tbsp. brown sugar

3 Tbsp. ketchup

1 Tbsp. pickapeppa sauce (or other hot sauce)

1 Tbsp. guava paste or jelly (or other fruit preserve)

¼ tsp. salt

3 Tbsp. vinegar

Mix all ingredients in a saucepan and simmer for 2 minutes. Chill before serving. 

Ginger Garlic Grilled Seafood

Four 6 oz. fish fillets, lobster tails, or skewers of shrimp

2 Tbsp. oil

2 Tbsp. lime juice 

1 Tbsp. ginger, grated or minced (or ½ tsp. powdered ginger)

2 cloves garlic, grated or minced (or ½ tsp. garlic powder)

1 scotch bonnet pepper, seeded and sliced thin (or other hot pepper)

½ tsp. each salt and pepper

1 lime, quartered

Bottle of hot sauce

Combine oil, lime juice, ginger, garlic, and hot pepper. Pour marinade over seafood and refrigerate for 1 hour. Preheat grill. Remove seafood from marinade. Season with salt and pepper, and place over medium heat until just cooked. Serve with lime wedges and hot sauce.  

-by Lori Ross

Subscribe For Weekly Updates

Exit mobile version