Summer Beach Safety

Summer Beach Safety

A day of family fun can quickly head south if you’re not careful, so practice summer beach safety.

A day at the beach is a perfect family activity. But to make sure nothing spoils that fun day, remember that safety should always come first. Here are some things to have on your summer beach safety checklist.

Before you head out, check the beach forecast available from many media sources but usually derived from the National Weather Service’s (NWS) Surf Zone Forecast. Officially, the surf zone extends from the high tide level on the beach out to the seaward side of the shoreline’s breaking waves, typically the area for beachgoers.

There are certain weather hazards highlighted in the forecast. I have discussed thunderstorms, waterspouts, tropical cyclones, and even fog, but two of the more innocuous weather hazards present on seemingly great weather days involve the sun and the heat.

Not So Fun in the Sun

Sunlight contains ultraviolet (UV) rays that can cause a painful sunburn or even worse, skin cancer. The greatest risk occurs when sunlight is at its strongest, generally around
midday. Summer is the worst time for exposure. You can absorb UV rays even on days with a light cloud cover. The forecast will usually include the UV Index, which gives a
number to your risk. Values over 6 indicate a high risk of harm to unprotected skin, and values over 10, which are common in the summer, represent extreme risk with skin
damage likely within minutes.

For protection, use sunscreen (SPF 30 or higher) or sun protective clothing (UPF 30 or
more) with a wide brim hat and sunglasses. Heat alone can make you sick, sometimes seriously, and because the body cools itself by evaporating sweat, the amount of moisture in the air—the humidity level—is also important. The Heat Index combines these two factors into a “feels like” temperature. A heat index of 105 or higher is considered the Danger Zone and is often reached in summer.

Pay Attention to Conditions

To avoid heat-related issues, stay out of the sun as much as possible. It can be 10 to 15 degrees hotter in full sunlight. Limit outdoor activities during the warmest part of the day.
If you are active, take frequent breaks, wear light-colored clothing and always drink plenty of fluids. The beach forecast will also typically include water conditions, such as wave heights, tide information and water temperature. In terms of danger, the NWS may issue a High Surf Advisory or Warning.

An advisory signifies that  “breaking wave action poses a threat to life and property within the surf zone.” Actual criteria for issuance vary by region. A warning denotes a  “heightened threat to life and property within the surf zone.” The forecast will also include the risk of dangerous rip currents. Local beach patrol or lifeguards will post warning
signs if rip currents are present as will television and radio weather reports. Many popular beaches have beach cams which make it easy to go online and see conditions before you head out. For long trips, you may want to check local newspapers, etc., to find out if any unusual weather phenomenon is happening.

Know Your Flag

Beaches with lifeguards or those under supervision will display colored flags that depict water conditions. A green flag means it’s safe to swim. A yellow flag indicates moderate surf and/or currents. Weak swimmers should wear life jackets or stay out of the water. Better swimmers should still use caution. A red flag warns of high surf and/or currents. Any swimming is discouraged but not forbidden. A total beach closure would be indicated by a double red flag (or sometimes a sign showing a red circle with a line crossing through it over the image of a swimmer). If dangerous marine life is present (jellyfish, stingrays, sea lice, etc.), a purple flag will fly. Shark sightings would prompt a red or double red flag.

Awareness

Besides the wave or current action, sometimes the water’s condition is problematic. Pollutants or a harmful algal bloom can pose a health risk. Something as major as the red
tide will have warnings on various websites and beach forecasts. An advisory in these cases cautions people that they go into the water at their own risk. If conditions warrant,
a beach closure may be ordered for public safety.

If everything appears okay and you go in the water, you should still beware of “sneaker waves.” These are considerably larger waves. Sneaker waves occur along the beach or coast. They are actually quite common and remain small enough to just be a nuisance. Larger ones, however, can sweep people walking on the beach into the water.

Check Yourself

Suppose you are on a secluded beach with no lifeguard or signage. You must make the call if it’s safe. Surf and water conditions require observation and good judgment. Remember the tips for spotting rip currents: anything floating on the water, such as seaweed, foam or debris that is moving quickly out to sea, an area where the water color is decidedly different from its surroundings, an area where there is a break in the incoming waves or a noticeable channel where the water is churning and/or choppy.

Unfortunately, these indicators may not be readily apparent, or they might not exist at all.
Above all, never swim alone. If you can’t get the latest weather information, check the
skies. Look for the development of puffy cumulus clouds. This means thunderstorms may occur. See which way the clouds are moving to know if you’re at risk. Listen for thunder. If you see a lightning bolt, start counting until you hear thunder; every five seconds means a mile away.

The NWS recommends seeking shelter if a storm is within six miles. Always have a plan, a safe place to go or an exit strategy if bad weather threatens to avoid spoiling a fun day.

By Ed Brotak, Southern Boating, July 2019

What’s a Wave?

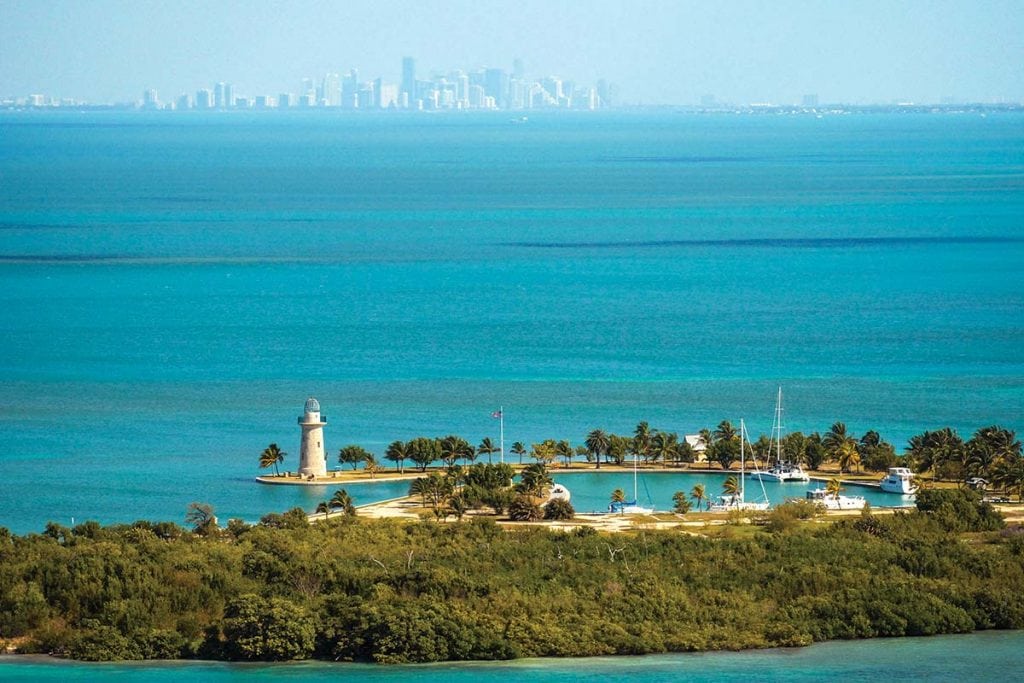
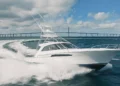
Every boater needs to know the surface condition of the water they are traversing. This condition is referred to as the “seas” and is the result of both waves and swells.

But what’s really going on here and what’s a wave?

What’s a wave? Time for some physics. A wave is a packet of energy that moves away from its source. Waves of energy are emitted from the sun, move through the vacuum of space, reach the earth, and heat it. If these waves of energy are moving through some substance, a disturbance is created. Waves on the ocean are packets of energy moving along and give the illusion that the water itself is moving. In reality,  it’s the wave energy that moves and causes the water level to progressively rise and fall as the wave passes, but the water actually moves in a circle with little forward motion.

The most common cause of typical surface waves is the wind. Friction between the water surface and the air just above it allows some of the wind energy to transfer down into the water. Although we typically only see the wave on the surface, the disturbance and water movement extend downward generally to half of the wave’s wavelength.

Geological Disturbances

In previous articles, I’ve discussed storm surges with hurricanes, tsunamis due to geological influences, and meteotsunamis associated with atmospheric pressure changes. In these cases, the sea level is actually elevated locally when the disturbance reaches the coast. When an oceanic wave approaches the coast, its structure changes. The bottom of the wave begins to slow due to frictional effects with the increasingly shallow ocean floor.

As the lower part of the wave slows, water converges, and compression forces water upward, building the height of the wave. With the top of the wave outracing the bottom, eventually, the wave becomes unstable and breaks toward the shoreline. The most significant aspect of a wave is its height, the distance from the trough to the crest. A wave’s size depends on wind speed, wind duration and the area over which the wind is blowing (the fetch). This will determine the total amount of energy transferred to the water.

Large waves are only produced when all three factors combine: strong winds, long duration and a long fetch over open water. Even under similar conditions, waves of varying heights are generated due to wave interactions. In standard descriptions of current or forecast conditions, the term “significant wave height” is used. By definition, this is the average height of the highest third of the waves. In my article on rogue waves, I noted, and official forecasts warn, that individual waves can be twice the size of the significant wave height.

Cascading Effects

Under extreme conditions, even larger waves can occur. There are other aspects of waves to note. The wave length is the distance between successive wave crests. The wave period, usually given in seconds, is the time it takes for successive waves to reach the same point. Swell waves, or just swell, refers to waves originally produced by wind that are now out of the generating wind field. They are more consistent and have a longer period than wind waves. These self-maintaining waves can propagate across the ocean for many miles and can move in directions that differ from the current wind field.

Reports on ocean conditions often include the swell direction, the direction from which the swells are coming. Don’t underestimate swell waves. In early March 2018, a powerful winter storm developed off the New England coast. Hurricane-force winds generated 40-foot seas over the North Atlantic. Swells generated by the storm propagated southward toward the Greater Antilles, more than 1,500 miles to the south. Buoys off the north coast of Puerto Rico recorded swell wave heights of 15-20 feet, record or near-record wave heights for March. Wave heights increased to as much as 30 feet and impacted the north coasts of Puerto Rico and the U.S.V.I. Widespread coastal flooding and beach erosion occurred.

A History of Waves

An interesting combination of wind speed and sea condition is the Beaufort Scale, named for Sir Francis Beaufort, an admiral in the British Navy. His original scale from 1805 related wind speed to sea condition and the ability to predict wind speed from sea condition and vice versa. For example, calm winds were associated with a “smooth and mirror-like” sea surface. On the other extreme, hurricane-force winds of 64 knots or greater were associated with “waves over 45 feet, a completely white sea due to spray and greatly reduced visibility.”

Current sea conditions are always available through the National Weather Service (NWS). You can also check out the National Data Buoy Center. Some buoys report wave height, wave period and wave direction. The NWS also provides marine forecasts that include sea conditions out to five days. There are numerical models that also utilize forecast weather conditions to predict wave heights. The Nearshore Marine Forecast or Coastal Waters Forecast covers a specific given area from the coastline out to 20 nm.

This is followed by an Offshore Marine Forecast or Offshore Waters Forecast that goes out from 20 to 60 nm, and finally the High Seas Forecasts for farther reaches. These forecasts will include wind wave and/or swell, or a combined seas or seas wave height along with the wave period for the near shore.

By Ed Brotak, Southern Boating February 2019

The Tsunami Threat

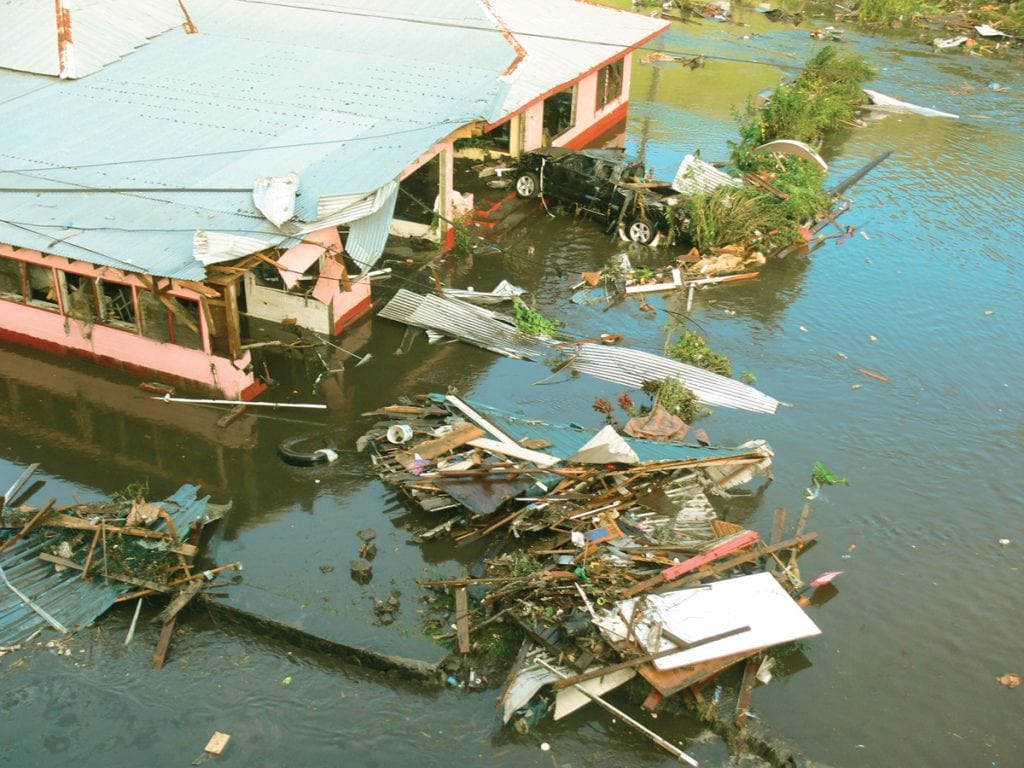
Due to its sheer magnitude and velocity, the tsunami is one of the most destructive forces in nature. From the Japanese words for “harbor wave”, tsunamis are actually a series of waves whose crests can be tens or even hundreds of miles apart. When this huge mass of water hits a coast, it can plow inland for miles like a raging river that can be over 100 feet high, and it can destroy everything in its path.

Unlike wind-driven waves or astronomically driven tides, tsunamis are the result of geological activity under the ocean floor, some movement that will cause a displacement
of a large amount of water, such as underwater landslides or volcanic eruptions. But the most significant tsunamis are caused by sudden movements of the sea floor associated
with earthquakes.

In the deep open ocean, a surface tsunami wave may only be a few inches high. But unlike other ocean waves, a tsunami wave extends downward to the ocean floor. This is
a tremendous mass of water, and the wave can be traveling at remarkable speeds of up to 500 mph. As it approaches a coastline and the water gets shallower, the wave slows to 20 or 30 mph; the water piles up, causing a significant rise in ocean level. When it reaches the coast, a tsunami seldom appears as a towering wave but rather like a fast-rising flood.

On average, locally damaging tsunamis occur twice a year, but major tsunami events that can affect areas hundreds or even thousands of miles away from the origin point only
occur about twice per decade. Since 1900, the seismically active Pacific basin has seen nearly three-quarters of all tsunami events. Less than 10 percent occurred in the Atlantic
and Caribbean.

In this millennium, there have been two historic tsunami events. In December 2004, a 9.1-magnitude earthquake off the Indonesia coast initiated tsunamis that killed 250,000 people some as far away as the east coast of Africa. Japan suffered devastating tsunamis that killed 18,000 people after a 9.0 earthquake hit in March 2011. The water traveled as much as six miles inland.

The US Tsunami Warning System run by the National Weather Service protects the citizens of the United States and its territories. There are two Tsunami Warning Centers. The one in Palmer, Alaska, serves the continental U.S., Alaska and Canada. The other in Honolulu, Hawaii, serves not only the Hawaiian Islands and U.S.-owned territories in the Pacific but also on the Atlantic side, Puerto Rico and the Virgin Islands.

To detect actual tsunamis as they are moving through the ocean, NOAA developed the Deep-ocean Assessment and Reporting of Tsunami (DART®) station which consists of a bottom pressure recorder anchored to the sea floor and a moored surface buoy with a transmitter to send information via satellite back to the Centers. The pressure sensor can convert a measured reading to the height of the ocean surface above, and if the system detects an unusual height, it will start sending readings every 15 seconds.

With the greatest tsunami risk in the Pacific region, the DART network of stations runs the length of the Aleutian Islands and southern Alaska as well as along the West Coast and Hawaii. Although the Atlantic is much less prone to tsunamis, there are stations off the East Coast, in the Gulf and off Puerto Rico where meteotsunamis tend to occur. With accelerated development along many coastlines and rising sea levels, future tsunami events could be catastrophic.

When seismic data indicate that a significant earthquake has occurred somewhere around the world, an Information Statement is issued immediately by the appropriate Warning
Center. Next, the nearest sea level gauges are closely monitored to see if a tsunami has been generated and its magnitude. The DART network will activate if a tsunami is approaching. If a tsunami has the potential to affect a covered area, there are three levels of alerts that can be issued by the appropriate Center:

  • Tsunami Watch: an event has occurred but the threat is yet to be determined. The public is advised to stay tuned for more information and be prepared to act.
  • Tsunami Advisory: implies strong currents and dangerous waves near the water and that people should vacate the beaches.
  • Tsunami Warning: dangerous coastal flooding and powerful currents exist. People are urged to seek higher ground and/or move inland. Warnings are typically issued within five minutes of the initiating earthquake. The official tsunami alerts are disseminated by local NWS offices.

Tsunami warnings are just one part of the National Tsunami Hazard Mitigation Program which includes agencies of the Federal government and 28 U.S. states and territories. Another component, Mapping and Modeling, uses computer analysis of possible tsunami events in conjunction with local topography to forecast the magnitude of potential flooding. The Mitigation and Education component is the public outreach to inform citizens of the tsunami risk in their area and what actions should be taken in response to the various advisories. To lessen property damage, land use policy and planning are also advocated.

By Ed Brotak, Southern Boating February 2018

ALL PHOTOS: COURTESY OF NOAA

Watch Out– Rogue Waves Ahead!

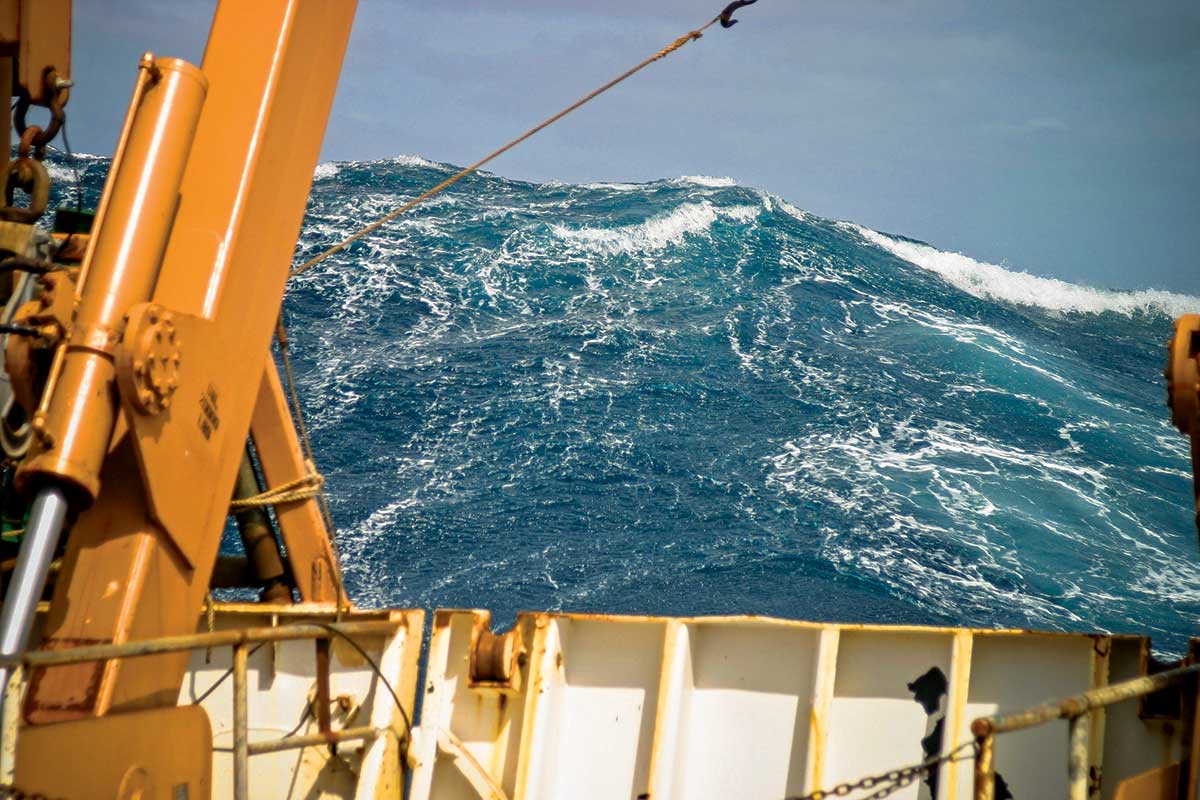
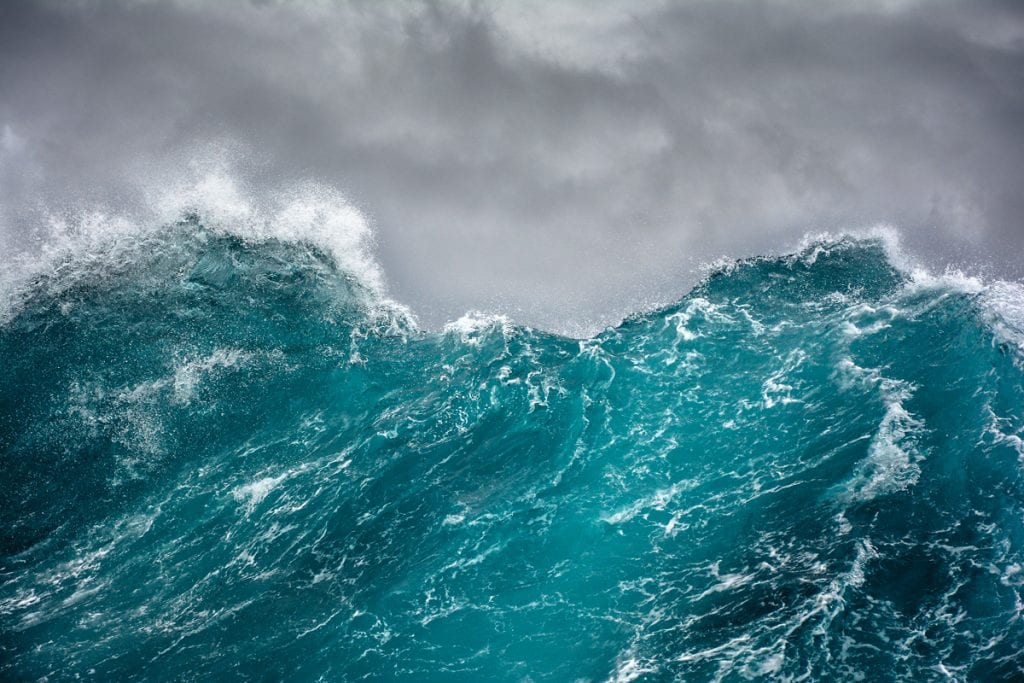
Scientists have yet to determine how to forecast where and when rogue waves will strike.

The 1972 blockbuster movie The Poseidon Adventure depicts a large ocean liner that’s capsized by a huge wave. Although fictional, the movie was inspired by an actual incident. The R.M.S. Queen Mary was almost capsized by a 70-foot wave while carrying thousands of U.S. troops in 1942, which would have been a far worse disaster than the Titanic sinking. For hundreds of years, mariners have talked about monster waves, and Christopher Columbus wrote of an experience with one in 1498. It is even speculated that a “freak wave” on Lake Superior was what sank the Edmund Fitzgerald during a storm in November 1975.

Scientists, however, have been skeptical of the occurrence of such great waves. Other than personal accounts of those who survived an encounter, there was no hard evidence of their existence and no scientific explanation of how they could occur. Waves of 40 or even 50 feet were seen as possible but not waves approaching 100 feet. That changed in January 1995 when the Draupner—an oil-drilling platform in the North Sea—was hit by a wave accurately measured at 86 feet. The “Draupner Wave” was twice as tall as surrounding waves and fell well outside the range of scientific predictions.

A “rogue wave” is significantly higher and steeper than other waves that are occurring at the time, typically defined as twice as high as surrounding waves. It may even approach from a different direction than other waves. Rogue waves can occur in turbulent conditions as an exceptionally high wave amongst other high waves, or they can occur with much calmer seas.

Now with definitive proof of the existence of rogue waves, scientists sought to determine their frequency. With newly developed methods of analyzing satellite data, they found that rogue waves are common in all of the oceans of the world, particularly in the North Pacific and especially the North Atlantic.

There are several theories describing the formation of rogue waves. If waves are coming in from different directions, two waves may physically join up. The newly formed wave could have a crest approaching the additive height of the two component waves. Another possibility is that when waves are travelling in the opposite direction of a prevailing current, the wave length shortens and one wave may actually catch up to another and build. In this case, regions with strong currents such as the Gulf Stream would be more prone to rogue wave occurrence.

Forecasting the occurrence of individual rogue waves is beyond science today, but the standard National Weather Service marine forecast allows for their possibility with the following caution: “Individual waves may be more than twice the significant wave height.”

In addition to rogue waves—as if that’s not enough—coastal areas have another phenomenon to deal with. On January 17, 2016, a tidal surge 5.5 feet above normal struck the Naples, Florida, area in the early morning hours. It had the characteristics of a tsunami, but no seismic activity had been reported. Meteorologists announced that it was a meteotsunami, a tidal surge consisting of a series of waves. Unlike typical tsunamis, which are caused by geologic events such as earthquakes, this phenomenon is produced by a marine weather system. This is different from a storm surge—the high tide that accompanies hurricanes and strong winter storms, which are wind driven. Meteotsunamis are caused by changes in atmospheric pressure which can in turn affect sea-level height. Often the culprit is an area of strong thunderstorms such as an intense squall line, which was the case in Naples. Development of a meteotsunami depends on several factors including the intensity, direction, and speed of movement of the weather system as it travels over water. Over open water, these changes may hardly be noticeable, but just like other tsunamis, it can become dangerous when it hits the shallow water near the coast as this causes it to slow down and increase in height and intensity. Even greater magnification can occur in semi-enclosed water bodies such as harbors, inlets, and bays. Damaging waves, flooding and strong currents can last from several hours to a day.

The NOAA vessel Fairweather approaches one of many data buoys, which provide real-time information critical for understanding and predicting El Niño and La Niña events, ocean currents, rogue waves, and more. photo courtesy of NOAA

Although not as potent as a typical tsunami, meteotsunamis can be destructive and even deadly. On July 3, 1992, a particularly destructive one occurred on Daytona Beach, Florida. A 10-foot wave came crashing ashore, injuring 75 people and damaging 100 vehicles as well as other property. On June 13, 2013, despite clear skies and calm weather, a meteotsunami caused injuries and damage from southern Massachusetts to New Jersey.

The largest meteotsunami ever recorded occurred in Croatia in June 1978, when waves up to 19.5 feet battered the coast for several hours, significantly damaging boats and port infrastructure. Meteotsunamis can also strike large inland waters. In 1954, a deadly meteotsunami hit Chicago’s Lake Michigan waterfront and swept people into the cold water, which resulted in seven drownings.

Recent research has shown that meteotsunamis are more common than previously thought especially along the Atlantic Coast and the Gulf of Mexico. Some estimates attribute up to 13 percent of all tsunamis to them. Meteorologists are trying to develop a system to forecast them in advance, but for now they remain unpredictable.

By Ed Brotak, Southern Boating Magazine January 2017

Exit mobile version