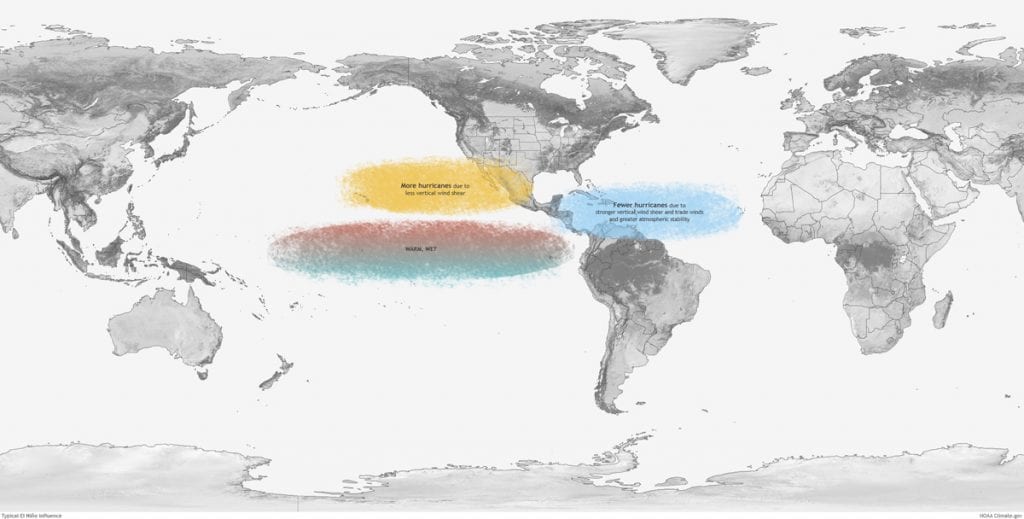
El Niño and La Niña

What’s the difference between El Niño and La Niña?

Long before meteorologists “discovered” the El Niño (EN) phenomenon, fishermen in Chile and Peru were well aware of it. Typically, the fishing there was great. The deep, nutrient-rich waters attract bountiful marine life, but every few winters, things would change dramatically. It got much warmer, it would rain in the coastal desert region and the fish would leave. A flood of warm water from the west would push the bountiful cold water to the south. Since this was often most pronounced around Christmas, they called it El Niño for “the boy.” La Niña (LN) is the female equivalent.

The Boy and the Girl

The El Niño and its counterpart, La Niña, have major impacts on the weather around the world, but did you know they are actually oceanic circulations? To explain the EN/ LN cycle, one must go to the tropical Pacific Ocean. With the cold Humboldt Current and associated upwelling, the eastern Pacific waters off of South America are abnormally cold, over 10ºF colder than sea surface temperatures in the western Pacific. In the tropics, the prevailing (or trade) winds tend to blow from east to west and drive the ocean surface waters with them. The North Equatorial Current flows westward from the South American coast across the Pacific to Oceania in the Asia-Pacific region.

There are times when the trade winds weaken and, consequently, so does the equatorial current. Warm water, which used to be transported across the Pacific, now begins to “back up.” Water temperatures then begin to abnormally rise in the central Pacific and work its way back to the South American coast. This warming can amount to a two- to six-degree increase over normal conditions, a significant departure for this vast amount of water. This is the El Niño.

With La Niña, the trade winds and equatorial current are abnormally strong. Larger than normal amounts of warm water is transported away from the central and eastern Pacific, and water temperatures there become unusually cool. Both El Niño and La Niña events tend to develop in the spring, hit their peak intensity in the winter, then weaken the following spring, about a 9- to 12-month average lifespan.

Cycle(s) of life

Meteorologists often refer to the EN/LN cycle as the El Niño Southern Oscillation (ENSO). The Southern Oscillation deals with the atmospheric pressure changes in the Pacific region that accompany the two phases. In addition to the two extremes, we can have more average conditions (called ENSO neutral).

So, how and why does the EN/LN cycle affect our weather? The tropical oceans are a vast storehouse of heat or energy. They transfer some of this energy to the air which goes high into the atmosphere and “feeds” powerful jet streams. Changes in the tropics can reach well into the mid and high latitudes.

The effects of the EL/LN cycle are most pronounced in winter. The warmth of El Niño fuels a strong, southern jet stream that starts in the eastern Pacific and produces an active southern storm track that blocks cold air from entering much of the U.S. Thus, we can expect northern tier states to be warm and relatively dry, the south having normal to cool temperatures and wet from southern California to the East Coast. In a La Niña event, the energy is concentrated in the western Pacific basin.

In this Hemisphere

For North America, La Niña brings a more variable northern jet stream and a northern storm track with occasional cold outbreaks. La Niña tends to bring warm and dry conditions to the south with cooler and wetter conditions to the north. Although the EN/LN cycle is less of a weather controller in summer, there is one important effect—El Niño summers tend to have fewer Atlantic hurricanes due to wind shear because of relatively strong westerly winds aloft in the tropics. Conversely, La Niña years see less wind shear and increased tropical cyclone activity.

You would think that because of its influence and possible major impact on winter weather, the EN/LN cycle would be a great forecasting tool for meteorologists. Yes, it’s often the basis of winter forecasts, but it’s not so simple. By closely monitoring ocean temperatures in the central and eastern Pacific, meteorologists can typically tell when one phase or the other is beginning, and because it takes months to achieve maximum strength, they can give advanced warning, but the EN/LN cycle is not a regular occurrence.

An El Niño event is not necessarily followed the next year by a La Niña. The return period on the cycle varies from two to seven years, and the strength of the actual event varies considerably. There are also other weather influences that can override the El Niño or La Niña effects, and these other factors can’t be forecasted months in advance.

Current State

The winter of 2015-16 saw the strongest El Niño on record and was the first El Niño since 2009-10. This was followed by weak La Niñas the next two winters. In 2018, fall saw tropical Pacific Ocean temperatures running above normal, and it appeared that an El Niño was developing, but it’s a weak one. The official winter forecast (Dec-Feb) reflects this with only the southeastern part of the country predicted to have near normal temperatures and the rest a bit warmer. Wet conditions are forecasted for the southern tier states, while the north is expected to be normal to dry.

You may wonder what causes the EN/LN cycle. Well, we don’t know. Does climate change affect the cycle? Probably, but it’s hard to prove. It’s speculated that the EN/LN cycle has been going on for thousands of years and, most likely, will continue for many thousands more.

By Ed Brotak, Southern Boating January 2019

Rip Currents

Rip Currents: Life or Death

If you’ve heard warnings of possible rip currents, take them seriously!

Last year in the United States, 62 people perished due to rip currents. That’s more deaths than caused by hurricanes, tornadoes or lightning. Furthermore, tens of thousands of people require rescue by lifeguards from these extremely dangerous situations each year. In fact, 80 percent of rescues performed by lifeguards are in rip current events according to the U.S. Lifesaving Association.

What causes a rip current?

When waves continuously come ashore along a beach, circulations are created in the water. Some of the water will move parallel to the coastline, and some of it will move back out to sea in a return flow. In calmer conditions, this return flow is fairly weak and inconsequential, but if waves are higher and the period between waves decreases (typically, but not always, related to a stronger onshore wind), this return flow can become concentrated like a jet stream in the atmosphere and produce a rip current.

Why they’re dangerous

Rip currents are more common where there is an obstruction to the water flow along the shore such as a pier, jetty, groin, or reef. One of the worst situations occurs when there is a sandbar just off and parallel to the shoreline, which will block the return flow of water. If a breach or break occurs in the sandbar, returning water channels through it, accelerating as it goes.

Rip current speeds are typically in the 1 to 2 feet-per-second range (.7 to 1.4 mph) but have been measured as fast as 8 feet per second (5.5 mph)—faster than Olympic swimmers. Rip currents vary in width from as narrow as 10 to 20 feet to several hundred feet across. They will extend out from the beach past where the waves are breaking, anywhere from a few hundred to a few thousand feet where they will dissipate. Rip currents can and do occur on any beach where there are breaking waves, even along the shores of the Great Lakes.

The summer months see the most rip current incidents because of increased beach usage and the significant majority of victims are young men. With miles of inviting beaches and temperatures that promote outdoor activities much of the year, Florida leads the country in rip current fatalities with an average of nearly 20 drownings per year. The states of North Carolina and Texas follow. Puerto Rico also had 11 victims in 2017, according to statistics from the National Weather Service (NWS). The NWS acknowledges that rip current fatalities may be underestimated.

Check before diving in

If you’re cruising in the U.S., check the rip current status in your area via the NWS, which includes a beach forecast on weather.gov as well as surf forecasts on ripcurrents.noaa.gov/forecasts.shtml. Local media outlets also typically carry beach forecasts and include the rip current risk forecast. Rip current forecasts are shown as Low (unlikely), Moderate (possible), or High (Life-threatening rip currents likely). Going to a beach area with lifeguards present offers the most protection; check with them to learn if rip currents are occurring or expected.

When visiting beaches without lifeguards, take extra time to assess for rip currents. For example, anything floating, such as seaweed or debris is moving quickly out to sea. That  is an indicator that rip currents may be present. Another indicator is an area where the water color is decidedly different from its surroundings, such as a break in a sandbar, a break in the incoming waves or a noticeable channel where the water is churning or choppy. Unfortunately, these indicators may not be readily apparent from the beach or water level. Dangerous rip currents can go undetected by a swimmer, especially when they’re not looking for them.

What to do

If you are caught in a rip current, don’t panic. The danger of rip currents is not that they will pull you under, which is what undertow does. Rip currents will pull non-swimmers and weak swimmers out to sea and into deeper water where they will tire quickly. Even strong swimmers will be in danger if they try to swim against the flow. The key is to swim parallel to the shoreline. Rip currents aren’t that wide, and even if you are swept out beyond the breakers, rip currents don’t extend much further. A caught swimmer will eventually break free as long as they remain calm and just float or tread water while calling for help. (This is one reason to swim where a lifeguard is on duty.)

If you see someone in trouble, get help from a lifeguard. When possible, get a flotation device to the person. If nothing else, try talking to them to calm them down while giving instructions for reaching safety. Never attempt to rescue someone unless properly trained. Numerous people have drowned while attempting to save someone else. Most of all, remain calm and swim on.

By Ed Brotak, Southern Boating June 2018

New Eyes in the Sky

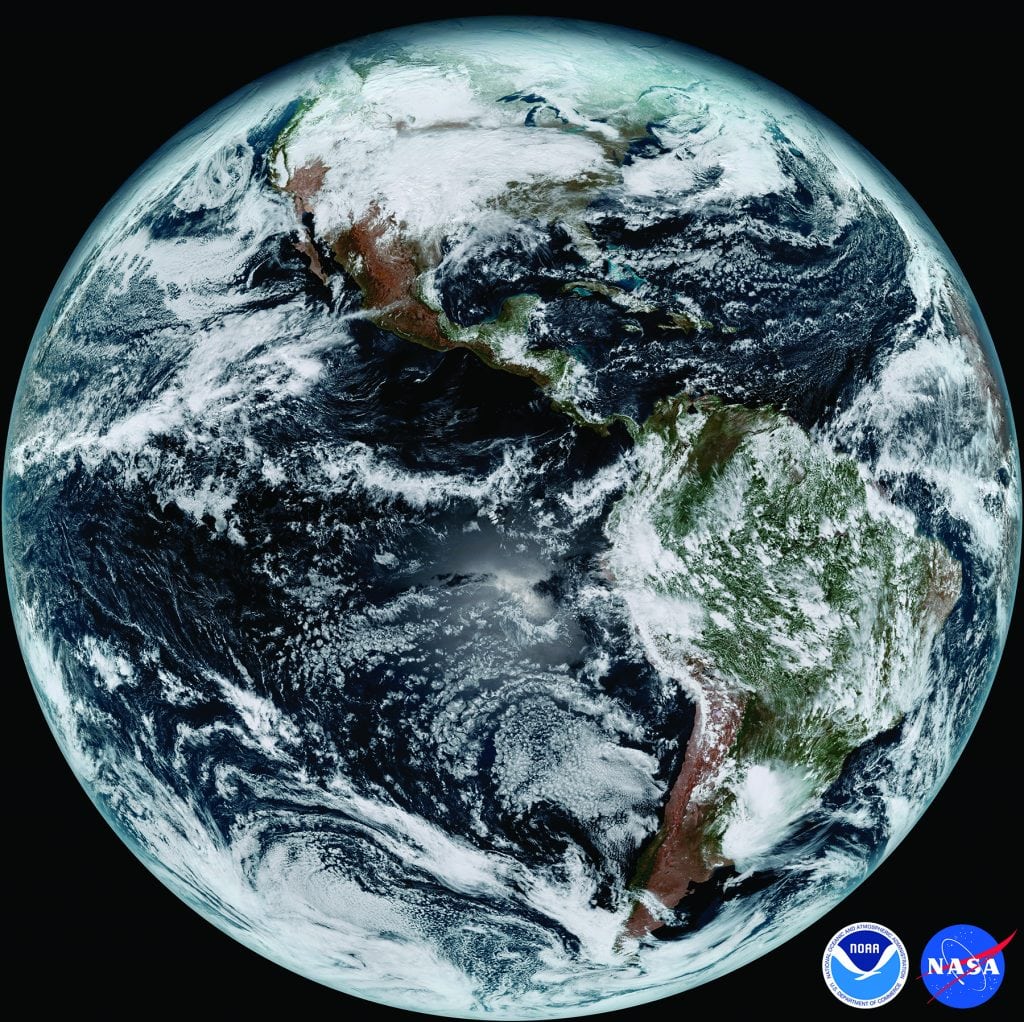
NOAA’s GOES-16 is changing the face of traditional forecasting.

The first of the next generation of Geostationary Operational Environmental Satellites (GOES) was successfully launched from Cape Canaveral on November 19, 2016. Although the satellite was referred to as GOES-R during the development stage, it was rechristened GOES-16 upon achieving earth orbit. It had been nearly seven years since the last of the older satellites, GOES-15, was launched.

The new satellites represent a major advancement in weather monitoring. Compared with the older satellites still in use, GOES-16 has three times the number of observing “channels”, four times greater image resolution and is five times faster. The satellite can generate 34 different products, and another 31 products are planned for the future.

To give you a full overview of its capabilities, this satellite can do a full disc scan of the Western Hemisphere every 15 minutes, scan the continental U.S. every 5 minutes and focus in on areas of severe or interesting weather every 30 to 60 seconds; all of this happens simultaneously. GOES-16 is also equipped with the first satellite-borne lightning detection system known as the Geostationary Lightning Mapper (GLM), which means that lightning can now be tracked continuously from space.

Currently, GOES-16 is undergoing testing and is planned to become fully operational in November 2017. The next satellite in the new series, GOES-S, is scheduled to launch in the summer of 2018. The projected operational lifetime of the new satellites is through 2036.

With increased sensor ability, we can analyze the atmosphere from top to bottom and trace atmospheric moisture, which is responsible for clouds and all precipitation and see how it moves. For marine interests, satellites provide weather information over vast ocean areas where there wasn’t any previously. Satellite data improves the accuracy of weather forecasts for everyone.

One of the biggest advances in meteorology due to weather satellites is the ability to detect and track tropical cyclones. Before 1960, scientists had to rely on boat or aircraft encounters with these storms to locate and determine the strength of the system. Even major hurricanes would sometimes avoid detection if they were in a seldom-visited section of the ocean; fast-moving storms could strike with little advance warning. This all changed with the advent of weather satellites constantly monitoring the tropical oceans. For example, GOES-16 can scan a tropical cyclone and use cloud top temperature changes and cloud structure to estimate the strength of the storm. It can monitor changes over time to determine if the storm is getting stronger.

With its high-resolution imagery, GOES-16 can provide great detail about individual thunderstorms for meteorologists to study further. Because images are available every 30 to 60 seconds, the development of the storm can be closely monitored and timely warnings can be issued if necessary. A lightning detector can show if the storm is becoming more or less active. This should mean better forecasts of the severe weather conditions that often accompany these storms.

The capabilities of GOES-16 are amazing. It can estimate rainfall rates at the surface, and future products will forecast the probability of rain occurring and how much can be expected. It can determine land and sea surface temperatures. Snow depth will be estimated from space. River flooding can be monitored closely in real time. Particularly for marine interests, GOES-16 will be able to closely monitor the direction and speed of ocean currents. Besides the weather on earth, GOES-16 will also monitor solar activity and “weather in space” that can greatly affect us. Improved instrumentation will closely track geomagnetic storms and flares on the sun that can disrupt communications and energy transmission on earth. It can also better determine radiation hazards above the atmosphere where our astronauts work.

MORE INFORMATION:

goes-r.gov nesdis.noaa.gov

By Ed Brotak Southern Boating May 2017

Signs it’s time to head back to shore

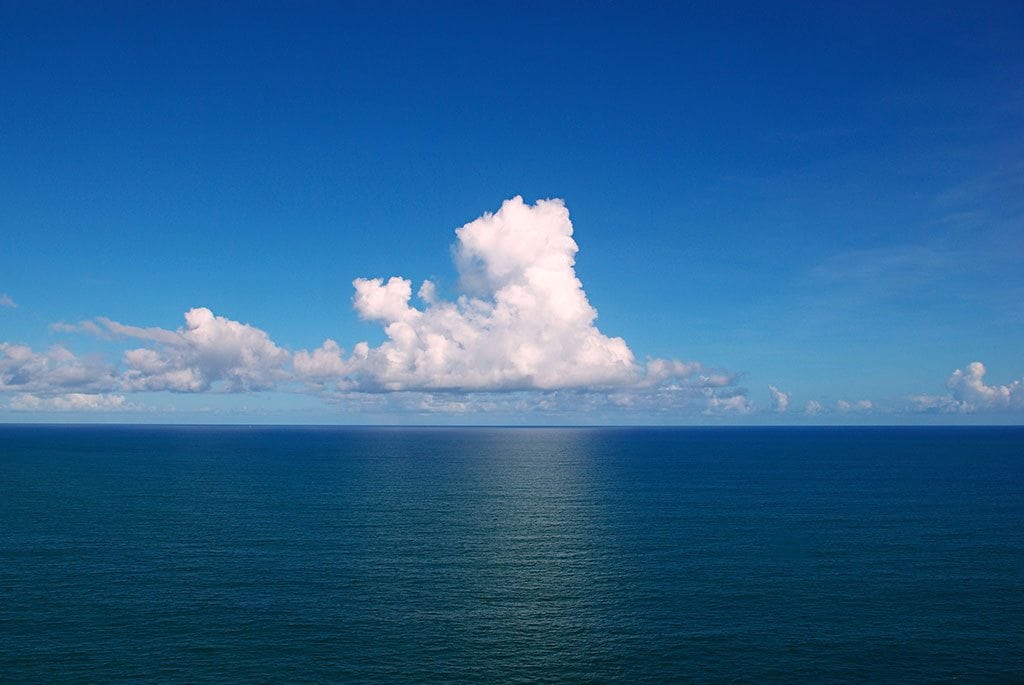
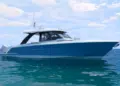
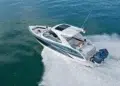
Summer brings the perfect conditions for a day out on the water. Whether you’re taking the boat out for a solitary cruise or showing friends and family that perfect snorkeling spot, there are plenty of opportunities to take a step back, grab a drink and soak up the summer sun. However, the start of summer also brings other changes in weather besides the heat—sudden storms can appear unexpectedly, placing you and your passengers in danger.

These days, checking the weather forecast is as easy as taking a quick peek at your smartphone for one of the many weather apps available or checking your onboard radar. However, the time-honored tradition of scanning the horizon can be just as handy when your cruising itinerary takes you outside the realm of cellular service. Keeping track of the cloud cover and how it changes is one of the best ways to make sure summer voyages remain safe and enjoyable for the entire crew. Here are some signs to help you determine if it’s time to head back to shore.

Clouds can appear in almost infinite configurations across the sky but can be separated into manageable groups. Determining which group those looming clouds in the distance belong to can help to ease worries about potential inclement weather. Different types of clouds have descriptive names that depend on their appearance. For example, the common cumulus cloud (which indicates fair weather) has a defined outline and dense texture while its sunlit parts reflect a brilliant white light. Stratus clouds are composed of a thick, light gray base layer. The sun is barely visible behind this type of cloud, which often indicates an upcoming light drizzle. Other clouds are based on their process of formation, so it’s important to keep an eye on their development in order to recognize potential hazards.

Predicting weather patterns can be as easy as asking a series of questions based on cloud formation. While scanning the skyline, ask yourself about the types of clouds you can see. Are they increasing or decreasing in volume and amount? Are they moving higher up into the atmosphere or moving closer to the surface of the water? Watch out for heavy, dense clouds with a vertical formation, such as the cumulonimbus, as these can signal approaching thunderstorms with strong winds. Mariners throughout the centuries have developed a few quick sayings, or proverbs, dedicated to remembering the signs of approaching storms. Here are some of the more popular ones:

Red sky in the morning, sailors take warning. Red sky at night, sailor’s delight.
A red appearance to the sky at night can indicate high-pressure systems and good weather ahead. However, a red sky in the morning can indicate high water content in the atmosphere as well as low-pressure systems moving in, meaning a potential chance of rain.

Mackerel skies and mares’ tails make tall ships carry low sails.
A few high-flying cirrus clouds signal fair weather. However, when they increase dramatically in number they create what is known as a mackerel sky, which carries the possibility of rain.

By Susanna Botkin, Southern Exposure June 2016

Exit mobile version