August 02, 2023
Weekly Market Outlook
By Donn Goodman and Keith Schneider
What’s the Stock Market’s Next Move?
Fortunately, for the past few months, we have provided much more positive input in your investment game plan and have backed these constructs with countless charts and graphs. In looking back, probably the charts from Ryan Detrick of Carson have been the most accurate and helpful as they showed what the market tends to do after being up 10% in the first few months.
Fear continues to dominate some of the financial publishing rhetoric.
We remain baffled and amazed at the large swath of writers who continue to offer a negative view even while the market makes new 52-week highs weekly. Many of these prognosticators were correct in 2022, consistently warning that we were about to see a bear market. They earned some credibility, and readers began to hang on to their every word. But many have been wrong in 2023!
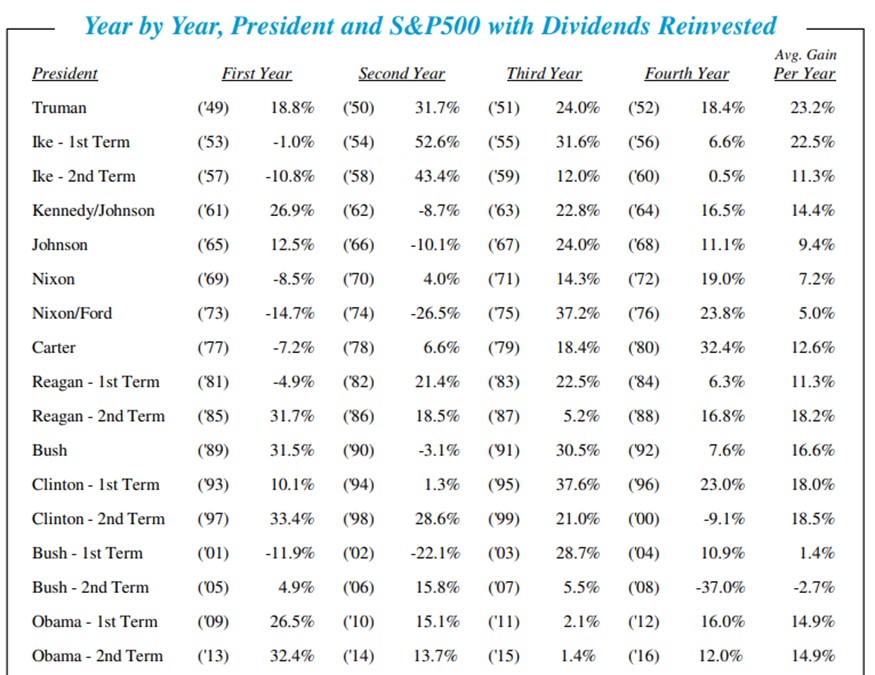
The problem with their numerous negative theses is that the stock market (and earnings) tend to go up 70% of the time. Additionally, as we have pointed out here, week after week, we are in a pre-election year. The bias for the 3rd year of a Presidential term has been positive (since 1950 100% of the time). See chart below:

The Signs Remain Positive
No matter how much fear the writers, talking heads and negative financial publishers say, the market continues to grind higher. More importantly, the underlying health of the market has continued to improve these past few months.
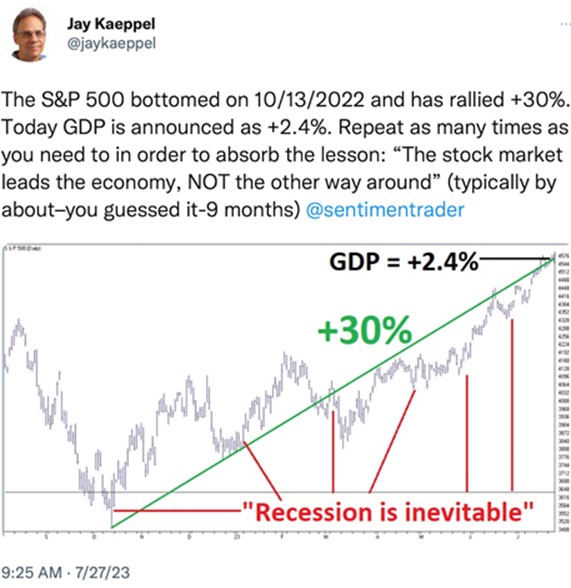
Yes, we may see a much-needed consolidation or correction soon, but most of the signs suggest that it may be shallow. Additionally, signs of a recession have not (yet) MATERIALIZED and while we may be pushing that off into some future moment (like 2024), this past week’s GDP of 2.4% growth handily beat the 2.0% expectations. See chart below:

It is important to remember there is approximately $4 trillion in infrastructure, CHIPS, and anti-inflation bills were passed during 2021-20222and much of that money has not yet found its way into the economy.
No matter how much the Fed raises rates, how much Quantitative Tightening the Fed imposes, we are still awash in new monetary stimulus coming from the Federal Government. Add to that, existing COVID money that remains in the economy, and you have the recipe for a continuing tight job market while consumers are still actively spending. Retail and consumer spending are holding up some parts of the economy.
**************
Discover Your Investing Strengths
Are you investing in a way that leverages your strengths? These 10 simple questions will uncover how to approach the markets in a way that plays into your strengths so you succeed faster and with less effort.
**************
We offer a few charts that illustrate why the stock market is on more solid footing: (thanks to LPL for producing great research this past week).
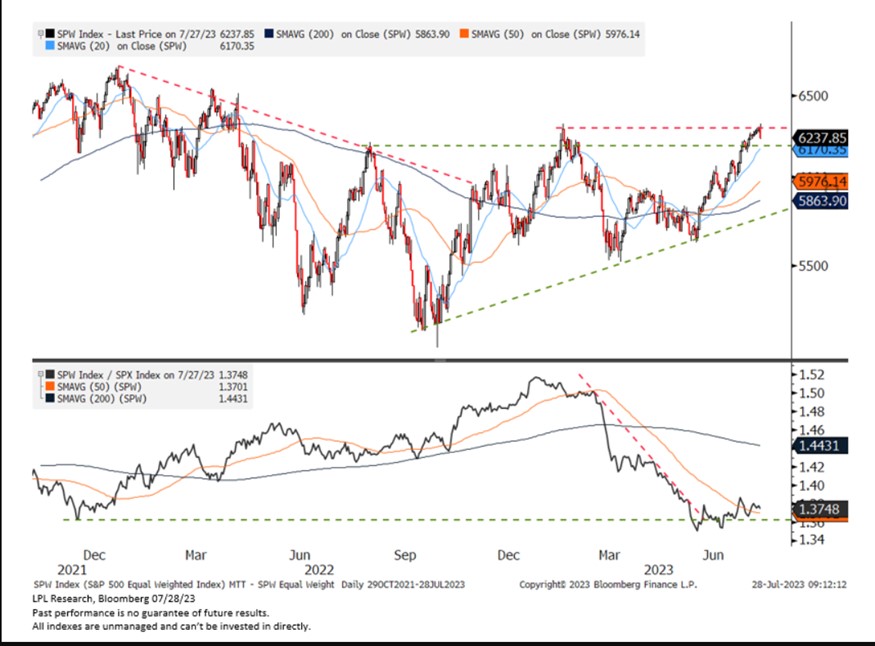
1. Broadening participation. The narrow leadership (the magic 7 stocks) no longer holds true. The Equal Weighted S&P 500 index (RSP) is now closing the gap:

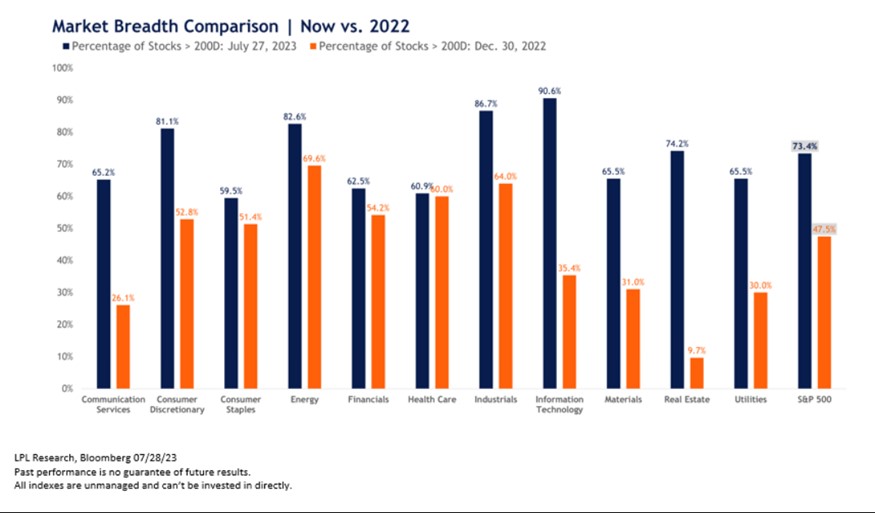
2. We went from bad breadth to good breadth.
The average stock in the S&P 500 is now trading above its 200-day moving average. This is a sign that breadth has improved and is positive. Should we go into a correction, it will take a lot to start knocking these stocks down when the breadth is so positive. See each industry group below with a comparison of November 2022 to now (July 2023):

There are additional charts that show the positive underlying indicators that are attracting investors to move money from the safety of money market funds to stocks. These positive charts give reason why investor sentiment has jumped to highs not seen since 2021. This is also helping to create an upward bias to stocks in the face of rising interest rates.


