Weekly Market Outlook
By Donn Goodman
MarketGauge Pro
May 22, 2023
Just a few weeks ago we were writing (and showing) potential caution signs occurring in the market. You may recall that in the April 7, 2024 weekly Market Outlook we posted a caution sign and presented several charts that showed the stock market might be in a correction that could get a bit nasty.
Much of the concern had (and remains) that inflation was stickier than expected and that with an elevated CPI and PPI we were likely to experience higher interest rates and no near-term Fed rate cuts. This is a mantra that both Mish and I had been expressing since late last year.
On May 4, 2024 just 4 weeks later, we showed multiple arrows and suggested that the market had snapped back. With three arrows, we showed the market now needed to gain some direction and wondered which way we were headed. We were aware (and showed charts to that effect) that the market goes through 5-7% pullbacks several times each year. However, we did not know if the April pullback was another shallow correction to an overbought market or the start of something that was far more negative.
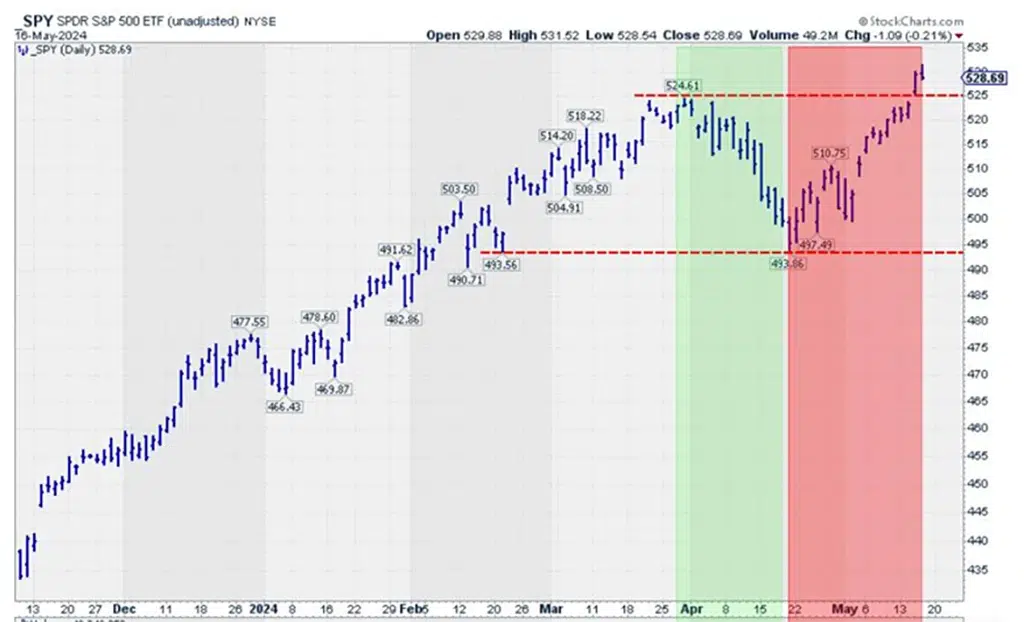
Now we know! With the recent breakout of the SPY, QQQ and Dow all reaching new highs (Dow 40,000), I believe we got our answer. See the following chart of the recent breakout in the S&P 500:
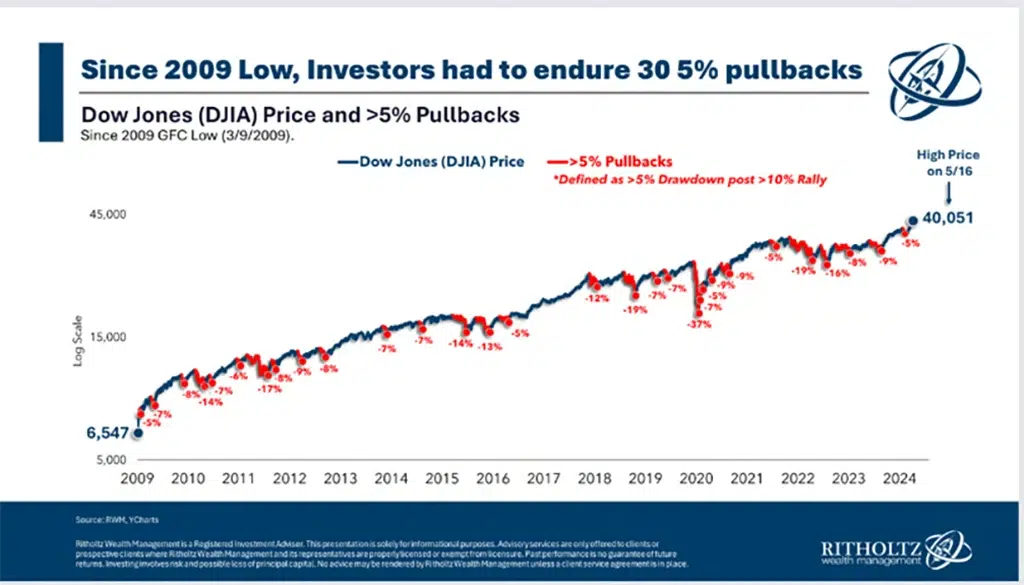
It also might surprise you to know that even though the Dow just hit 40,000, a new all-time high, it has experienced 30 5% corrections since the great financial crisis of 2009. See chart below:
As we wrote in last week’s Market Outlook, this recent earnings season has delivered better than expected corporate earnings. If you have not yet read the article, we provide the link here.
Earnings Update.
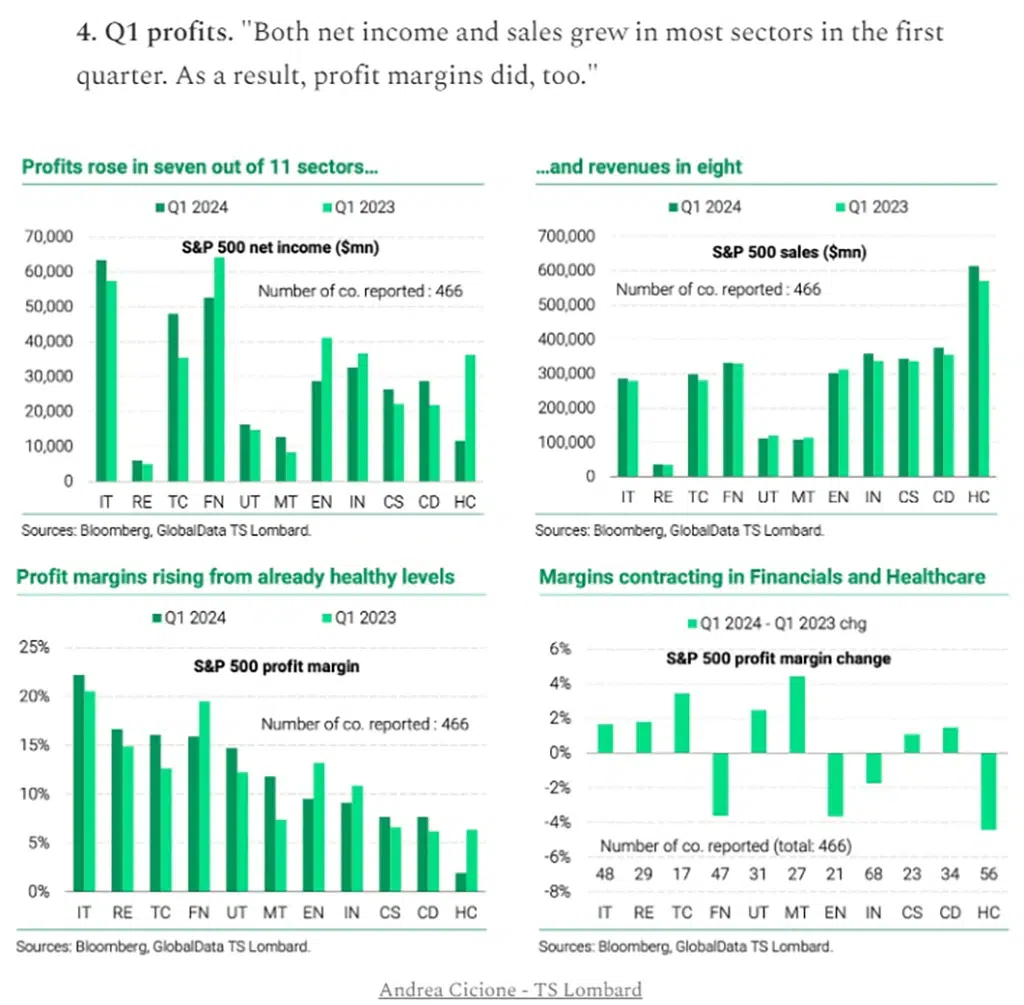
According to FactSet, 93% of public companies have reported earnings for Q1 2024. 78% beat their earnings estimates (remember that these estimates were ratchetted down after 2023’s better than expected earnings) and 60% of those companies beat on their top line revenues.
The earnings growth rate came in around 5% versus expectations of 3.5%. This has been a significant beat and much of the reason the markets have been able to grind higher, especially in the face of elevated interest rates, which tend to have a dampening effect on stock prices.
Earnings are expected to grow at an 8.8% yearly rate this year, according to Y Charts. However, much of the reason the markets have had positive returns during 2023 and now 2024 is due to the over 20% growth of earnings from the 1Q of 2023 to current quarter 2024 (again according to YCharts).
Please remember it is the expectations of earnings growth that usually propels stock prices higher. Right now, much of the tailwind for the stock market remains the expectations that the Fed will cut rates and stock prices can continue to go up as lower interest rates will help sustain stock P/Es and multiples higher.
To provide a more detailed and elaborate picture of just how good earnings have been, we provide the following chart:
Don't Get The Weekly Newsletter? Join Here:
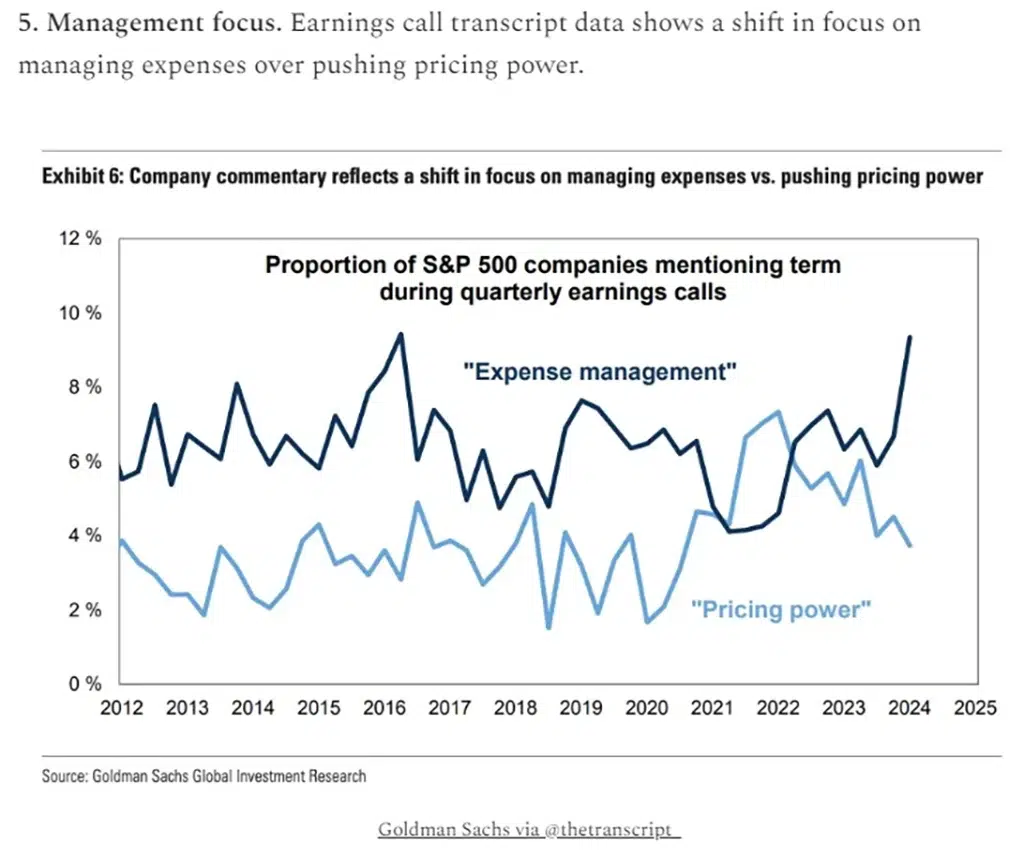
The positive economic mantra is that inflation is trending down and some of the accompanying recent economic indicators show a softening economy. This has been echoed numerous times during recent earnings announcements by corporate CEOs and CFOs as they communicate a “cautious” next year forecast. The corporate management folks are now concerned about reigning in costs more than they feel they can increase prices. See chart below:
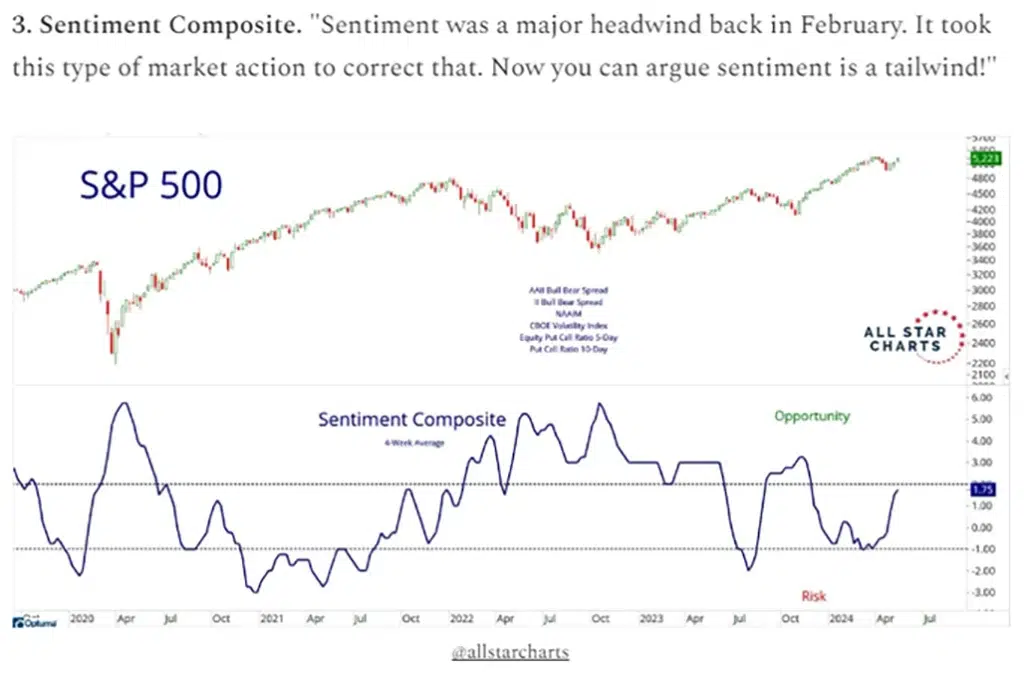
Investor Sentiment readings have turned positive.
Another bright spot in the readings right now is that investor sentiment has gone from headwinds just a short few months ago to now a tailwind. According to All Star Charts below, this should help the markets sustain their recent gains. See chart below:
Historically what happens after the S&P 500 hits a new high?
Since mid-last year we have been showing charts showing that historically if you buy the market (S&P 500) after each time it hits a new high, 6 months and 1 year later the market has been up the majority of times.
Interestingly, our core investment model (offered by subscription as well as through asset management) which uses the S&P 500 index, has been invested since early this year. If you would like more information about that strategy or any of the other market beating models, please contact Rob Quinn at Rob@MarketGauge.com
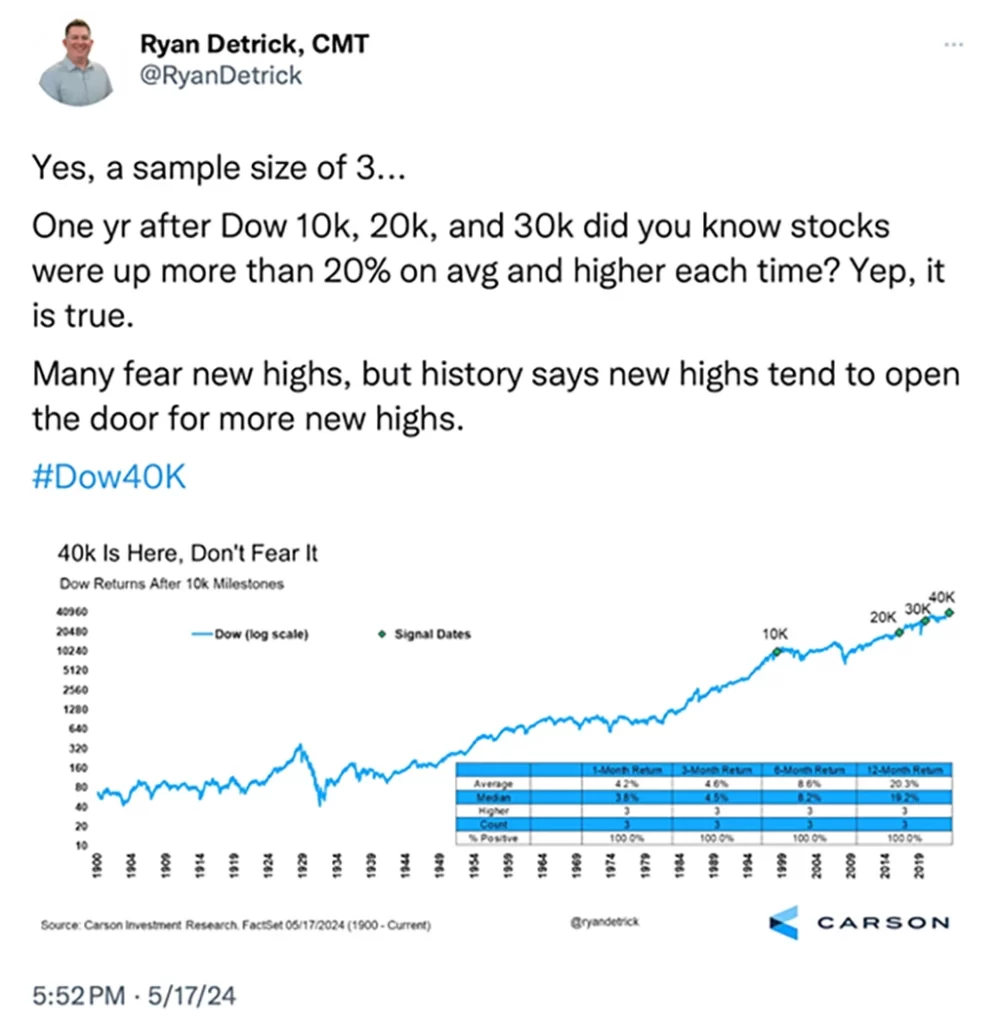
Below is a recent chart from Ryan Detrick of The Carson Group that shows what historically has happened after the S&P 500 hit a new all-time high. Remember, we are also in an election year which has had a high probability of producing positive stock market returns.
If the S&P 500 finishes in May on the positive path it is currently on, what might occur? Below we provide some interesting numbers of previous periods when May was positive after a good start to the year.
Use the link below to continue reading about:
- The probabilities of future up and down trends based on the current market breakout
- The big upside in metals
- 6 important market or economic conditions to keep in focus
- The Big View bullets
- Keith’s weekly market analysis video


