December 20, 2023
Weekly Market Outlook
Welcome Gaugers, friends and interested readers. Happy you joined us.
By now, you are well aware that on Wednesday Jerome Powell and the Fed became “dovish” and pivoted to a STOP on interest rate hikes. More importantly, the Fed Chairman stated that the Committee could see as many as three rate cuts in 2024. Most analysts had suggested (or predicted) that we would see only two rate cuts next year, but Jerome Powell gave an indication that we could see as many as three 25 basis point reductions in the Fed Fund rate during 2024. The markets reacted favorably, and the party (which may have begun in early November) kicked into high gear.
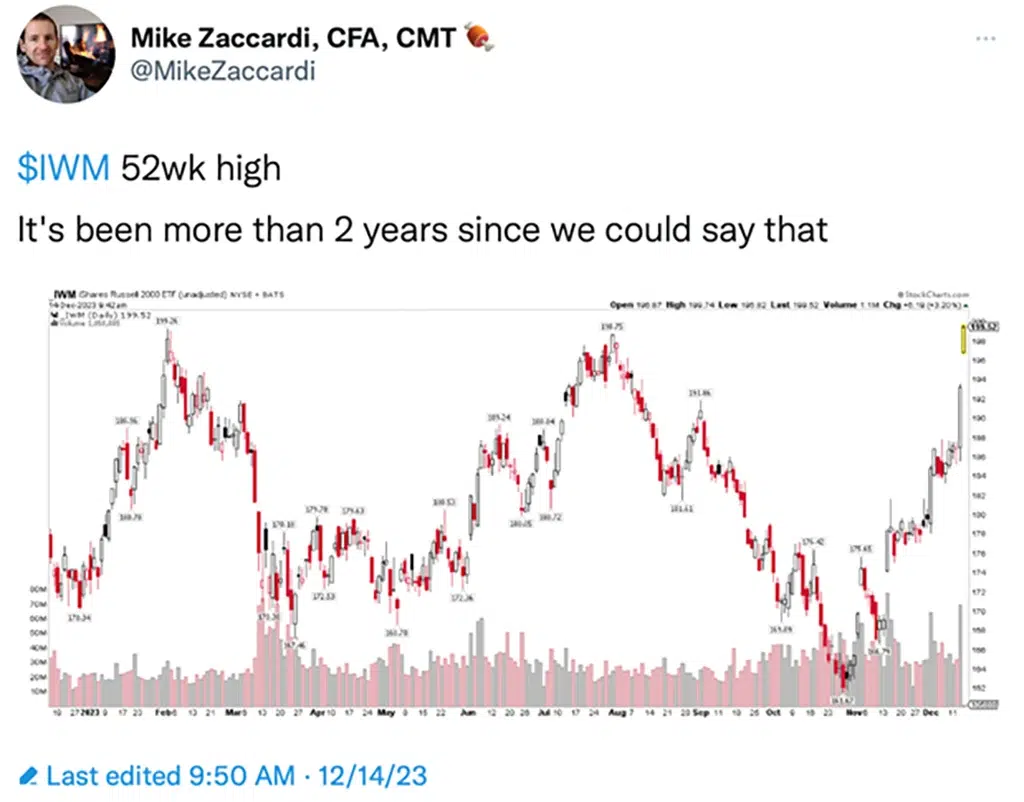
For the week, the major markets were up between 2.5% (S&P 500) to 2.9% (QQQ). Small-cap stocks (IWM), which had been trending sideways for most of the year (due to higher borrowing costs, which affect smaller companies more than the big cash rich companies), rallied 5.8% and now puts the Russell 2000 Small-cap index in double digit returns for 2023.
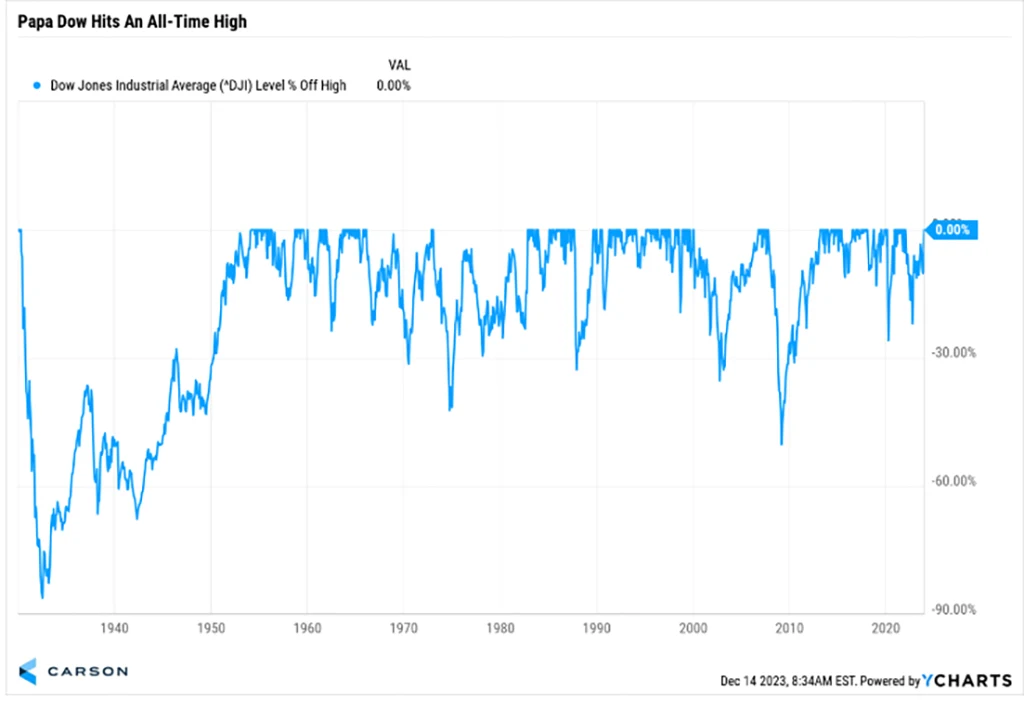
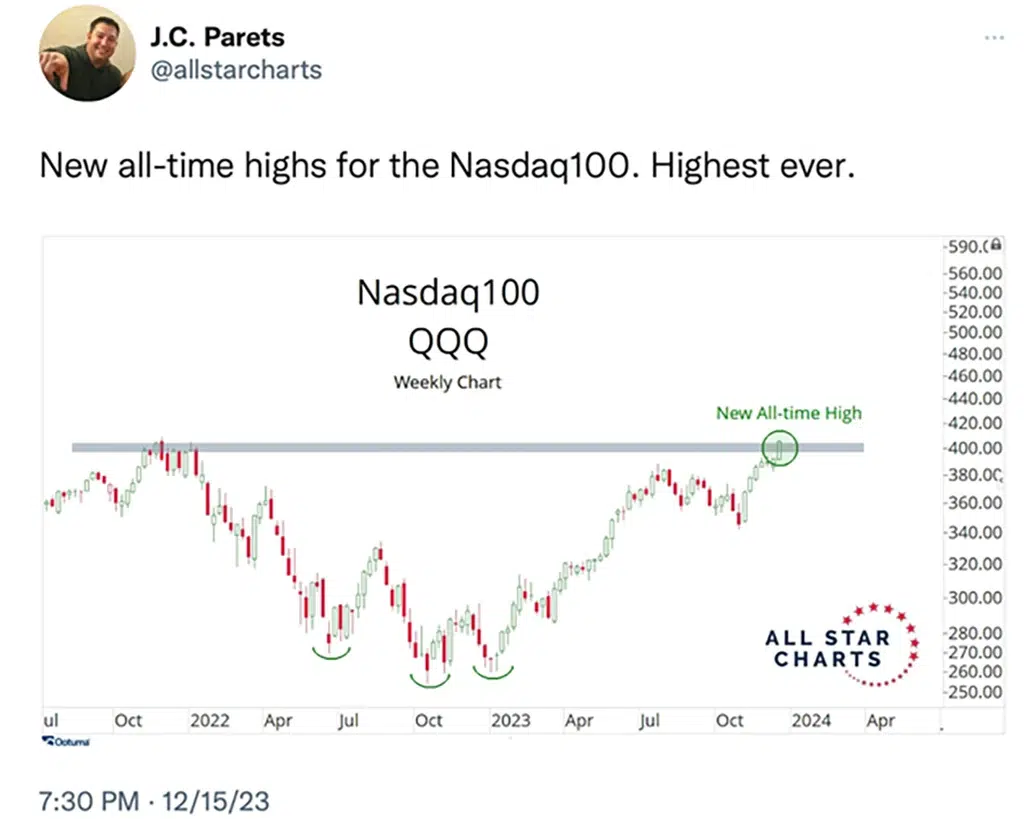
The Dow and the NASDAQ 100 (QQQ) both made new all-time highs and have been positive on a 7 week winning streak. You may want to go back and reread our Market Outlooks from the last 7 weeks and the various indicators that had been forecasting a bullish move up in the markets, including our own Profit Navigator which got fully invested in the SPY ETF in late October. (Profit Navigator took two profit targets this week locking the gains from late October).

We provide a few charts illustrating the new all-time returns of the DOW and the QQQ. See below:
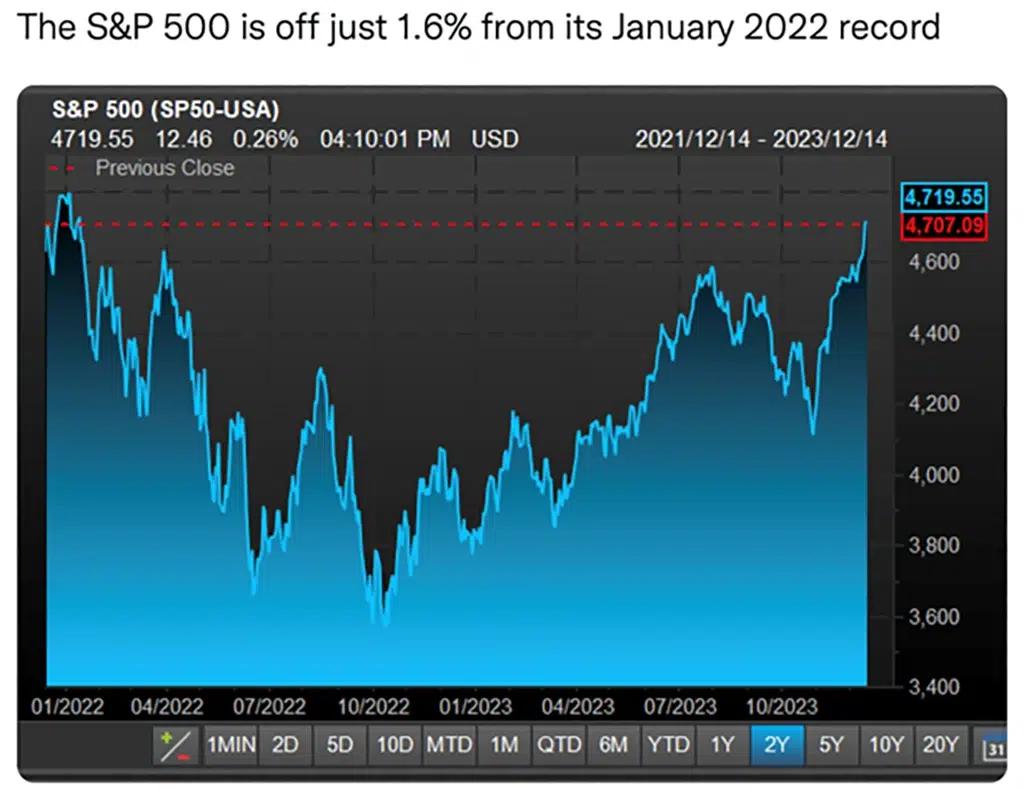
The S&P 500 is also a whisker away from hitting a new all-time high. In bull markets old highs act as magnets and attract the indices to them as do whole numbers like 4800. We are optimistic that the S&P 500 will soon pierce its old number. More on that to follow. See chart below:
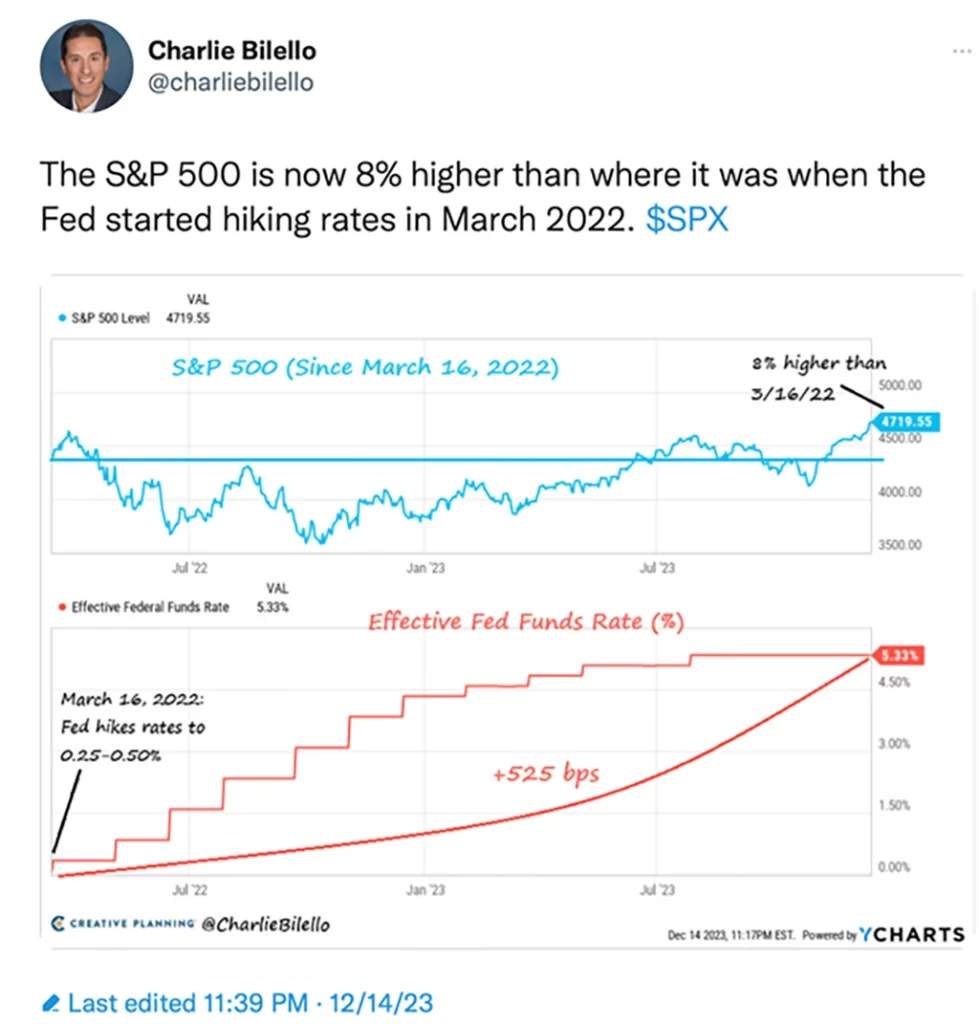
Not only is the S&P about to post new highs, but surprisingly it is now 8% higher than when the Federal Reserve began its hawkish hiking campaign. See chart below:
Small-Cap Stocks.
While the Russell 2000 small-cap index (IWM) is nowhere near its all-time high, it did make a new 52-week high and has picked up momentum that may help provide a tailwind for this market capitalization segment of the market. Many of these companies depend on financing and carry a higher % of debt on their balance sheets especially as their businesses are growing rapidly. So, the fact that interest rates have come down markedly implies that smaller companies may feel the financial loosening benefits more quickly. See IWM chart below:
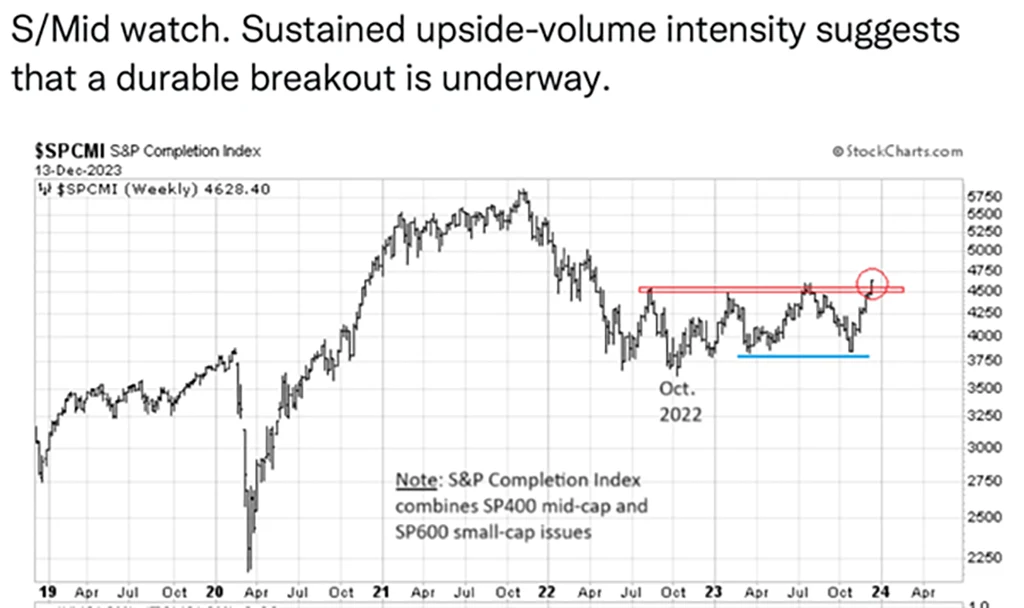
Please note: MarketGauge has a small-midcap earnings based strategy that, if followed this year, has produced a return of more than 45% for 2023. This (real + back tested results) model has produced a better than 34% return (without fees) per year for almost 7 years since its inception. Also, the IWM and MDY (Midcap index) are both negative for 12 months while this strategy is up over 27%. We show a growth of $100,000 chart below ($100,000 was up over 5x in 7 years) If you would like more information reach out to Rob Quinn at Rob@MarketGauge.com.

From these various charts, it is important to stay aware that the indices (SPY, DIA, QQQ and IWM) are comprised of a large number of stocks. While these are all cap weighted indices, the equal weighted S&P 500 (RSP) and the QQQ (QQEW) have both begun to rally impressively. Meaning= many of the average stocks are breaking out. This explains why the indices are hitting new all-time or 52-week highs.

See additional charts below:
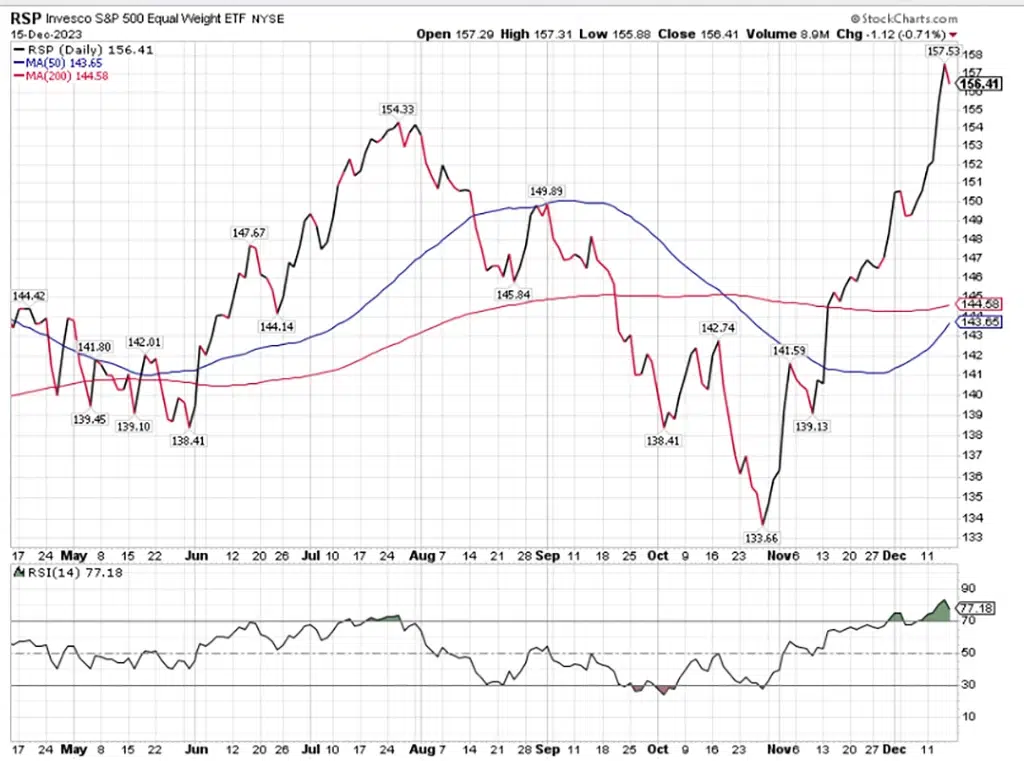
You will note above that the 50-day (blue) moving average may soon go through the 200-day (red) moving average, which is called a positive Golden Cross. Also, it is not lost on us that the RSI (Relative Strength Indicator) is well above the 70 number, which typically marks the beginning of an overbought move. While this can go on for a lengthy period, a reversion to the mean typically takes place at some point when investors capture gains. However, in this case, it may not occur until after the beginning of the year, and we welcome a new tax period for capital gains.
Below, you can see that the 93 lower capitalization stocks (ex-magnificent 7) have perked up and are beginning to look more positive. See chart below:

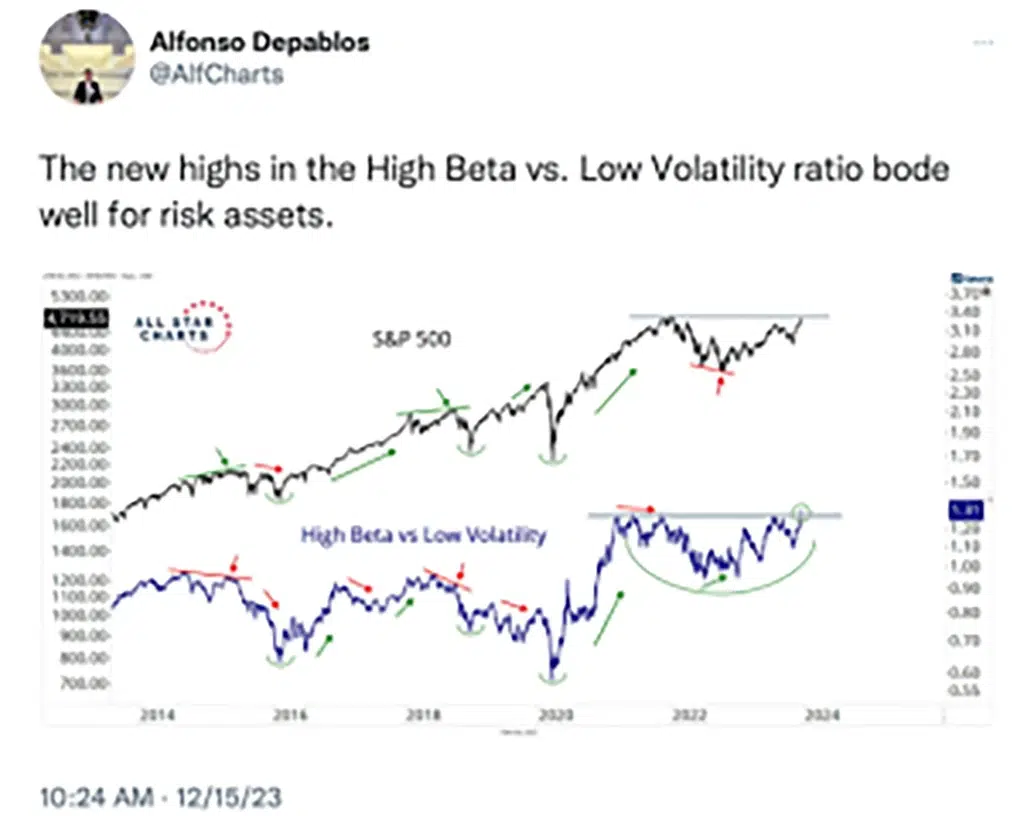
2023 has rewarded high growth stocks. These cash-rich companies have been the biggest beneficiaries from earnings growth and the lower volatility/high beta stocks have mostly gone sideways. As shown above through the RSP and the QQEW these stocks have now joined the party. See chart below:
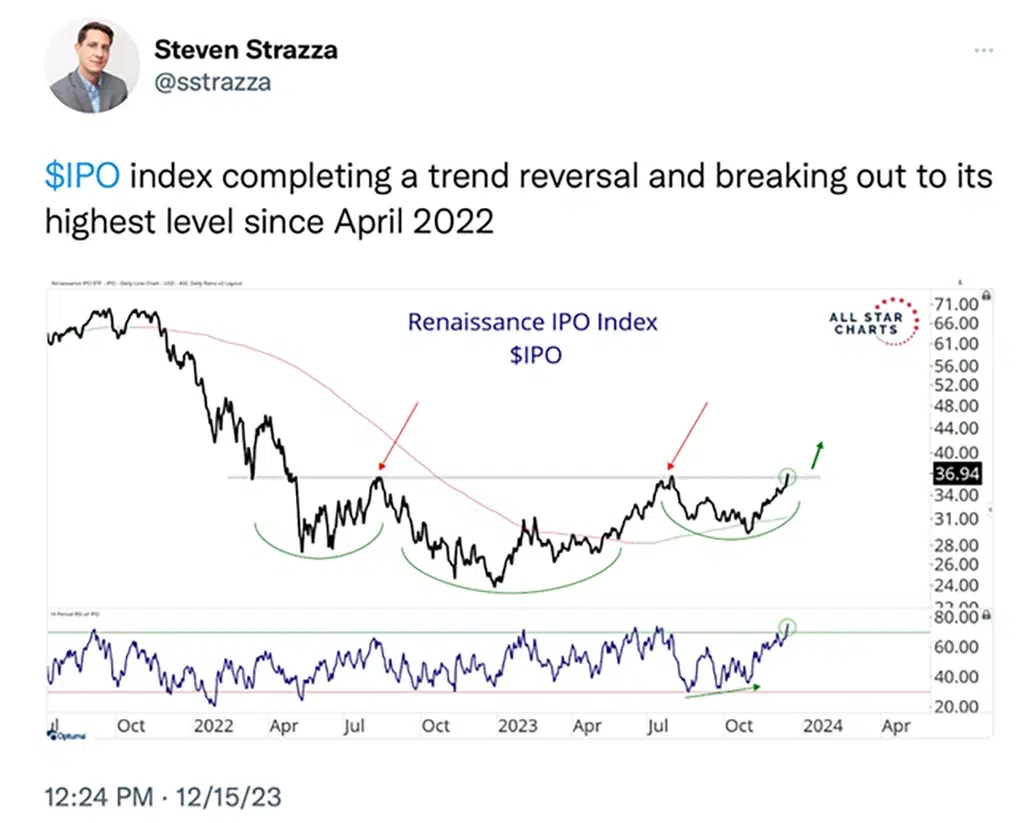
Speculation through new Initial Public Offerings (IPOs) is also seeing a major rebound recently. See chart below:
The Fuel That Created This Push Higher.
Click here to continue reading about:
- The Fuel That Created This Push Higher.
- The Big View Bullets
- The Weekly Big View Video analysis


