Weekly Market Outlook
By Donn Goodman
January 10, 2023
Welcome to 2024. We hope that you and your families had an enjoyable and relaxing New Year’s holiday and that you ushered in a good start to the year.
Unfortunately, we couldn’t say the same about the stock and bond markets this shortened first week of 2024. The market was down the first 4 days of the New Year and is causing concern as the first five trading days are closely watched. Many investors believe the first five-day period is an accurate indicator of what might become of the year. We explore this and other historical patterns later in this Outlook.
The market was weighed down by several negative factors that began before the bell even rang at Broad and Wall on the first trading day of this New Year.
Apple’s demand is slowing
Barclays downgraded Apple before the market opened to signal the new trading year on Tuesday. Concerns about demand for iPhones in China appear to be the culprit. Apple was up 50% in 2023 so it was no surprise that there might be a pullback sometime in 2024 when the New Year resets the capital gain period, one of several reasons we suggested last week there could be profit taking in the near future. Apple makes up 7% of the S&P index. So when it declined over 3% in the first trading day of the year, it’s not surprising that it took much of the market, especially tech stocks, with it
Fed Minutes
Wednesday, the December Fed meeting minutes were released and indicated that several Fed Governors voiced a much more hawkish posture than had been previously communicated. This weighed on interest rates and produced a selloff in bonds.
New Jobs Created
Thursday’s ADP report indicated that there was a high likelihood that the Jobs number would be hotter than expected with its release on Friday. This continued the “hawkish” rhetoric that began on Wednesday and put additional weight on the stock market.
Friday, the labor market reported the addition of 216,0000 jobs in the month of December, up from 173,000 the previous month. Economists surveyed by Bloomberg had expected 175,000.
We had our first negative week after a 9-week rally in the markets and ended the week with the 10-year interest rate above 4%, a seemingly important line in the sand for many fixed-income investors.
Data from the Bureau of Labor Statistics released on Friday showed the unemployment rate was 3.7% for the month, the same as reported in November. Most economists had expected the unemployment rate to tick higher to 3.8%.
Investors were closely watching for signs of whether the Federal Reserve can avoid a recession in 2024 and achieve the so-called soft landing, where inflation retreats to the Fed’s goal of 2% without a recession. This will have an important impact on the Fed’s timeline for cutting rates this year.
Here is a look, day by day of the different stock indices along with other markets including bonds (TLT), the metals (GLD & SLV) and the US Dollar (UUP) which saw strength from the rise in interest rates. See below:

Small-cap and Technology stocks were the hardest hit after their big gains during November and December. Perhaps the Santa Claus Rally came early as a direct result of the Fed Pivot which we wrote about the last two weeks. If you wish to review these Market Outlooks, the links are below.
Dec. 24th: Plenty of Market Gifts This Year! What’s In Store for 24? (Part 1)
Dec. 31st: Well Beyond The Forecasts. What’s in Store for 2024? (Part II)
Coming into 2024
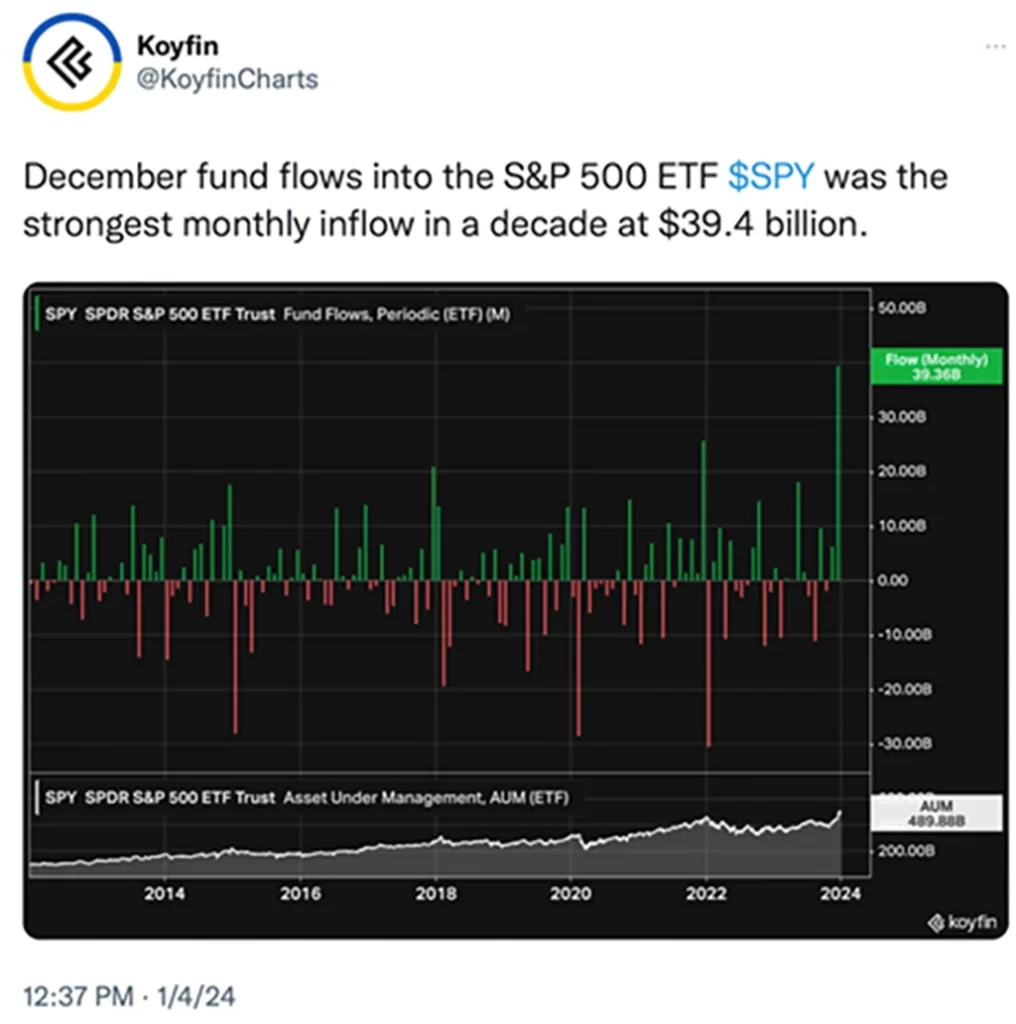
After the good year in the S&P 500 (up 24.6%) it was apparent that we were experiencing a powerful appetite for stocks as more than $39.4 billion of inflows came into the equity markets, an amount not seen for a decade. See chart below:
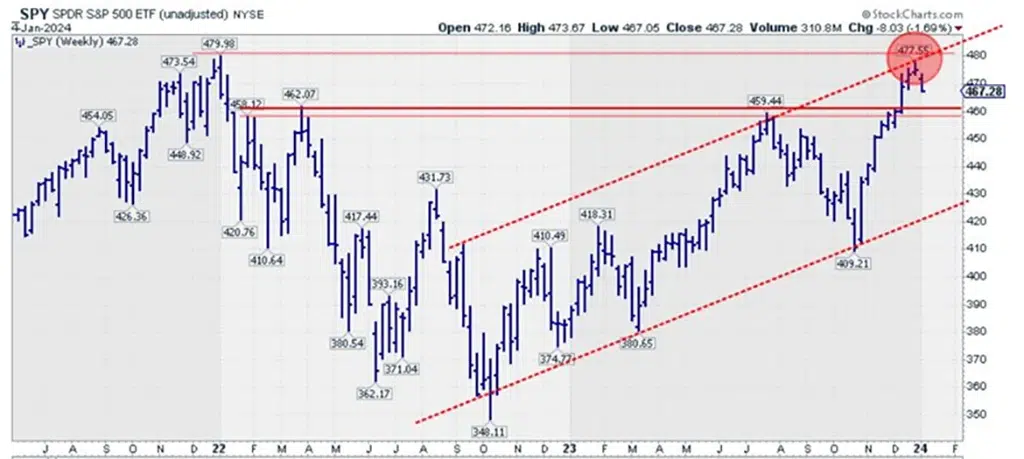
Due to these inflows and big returns in both November & December in most, if not all of the stock indices/markets, it is no surprise to see that the S&P 500 index became stretched with the price action hitting the top of its longer-term channel. It was no surprise that we got a swift retracement and bounce off the top of this channel. See chart below that illustrates this clearly:
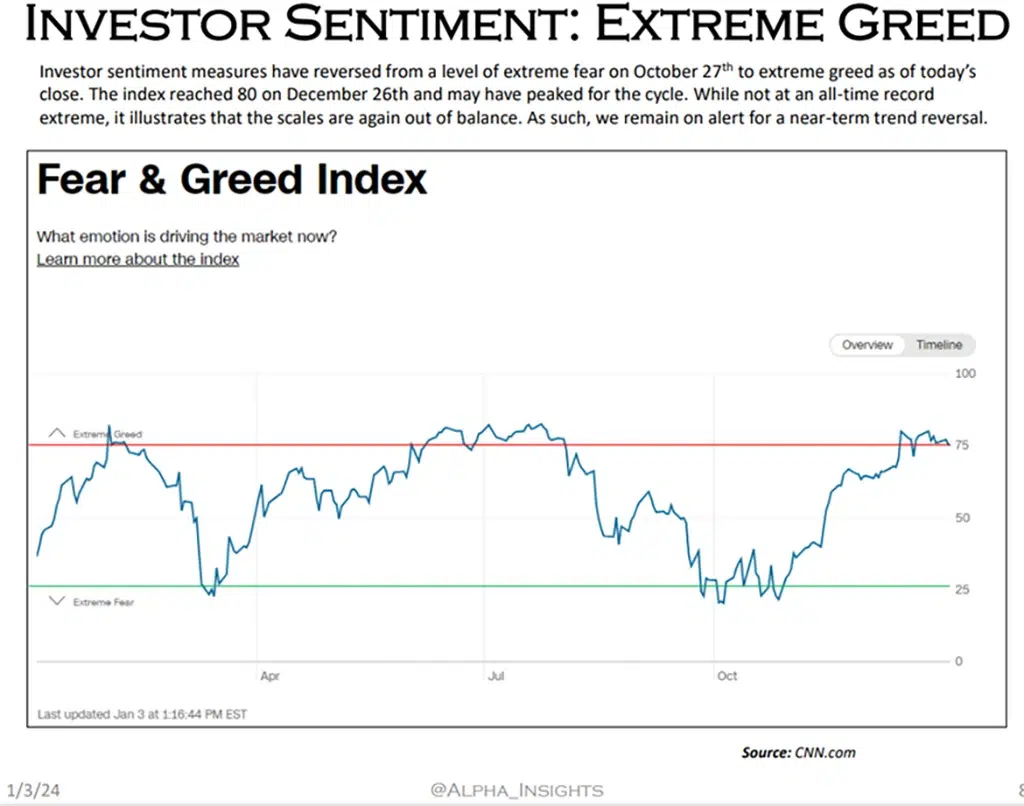
As evidenced from the 4th quarter of 2023’s money flows and sensational market rally, investors had shifted from October’s caution to a sentiment of extreme greed. Even with this week’s pullback, this indicator still shows a high level of greed. These periods often precede a pullback in stocks. Courtesy of our colleague Jeff Hugh of Alpha Insights. Obtain his information at www.JHWInvestment.com. See the fear/greed chart below:
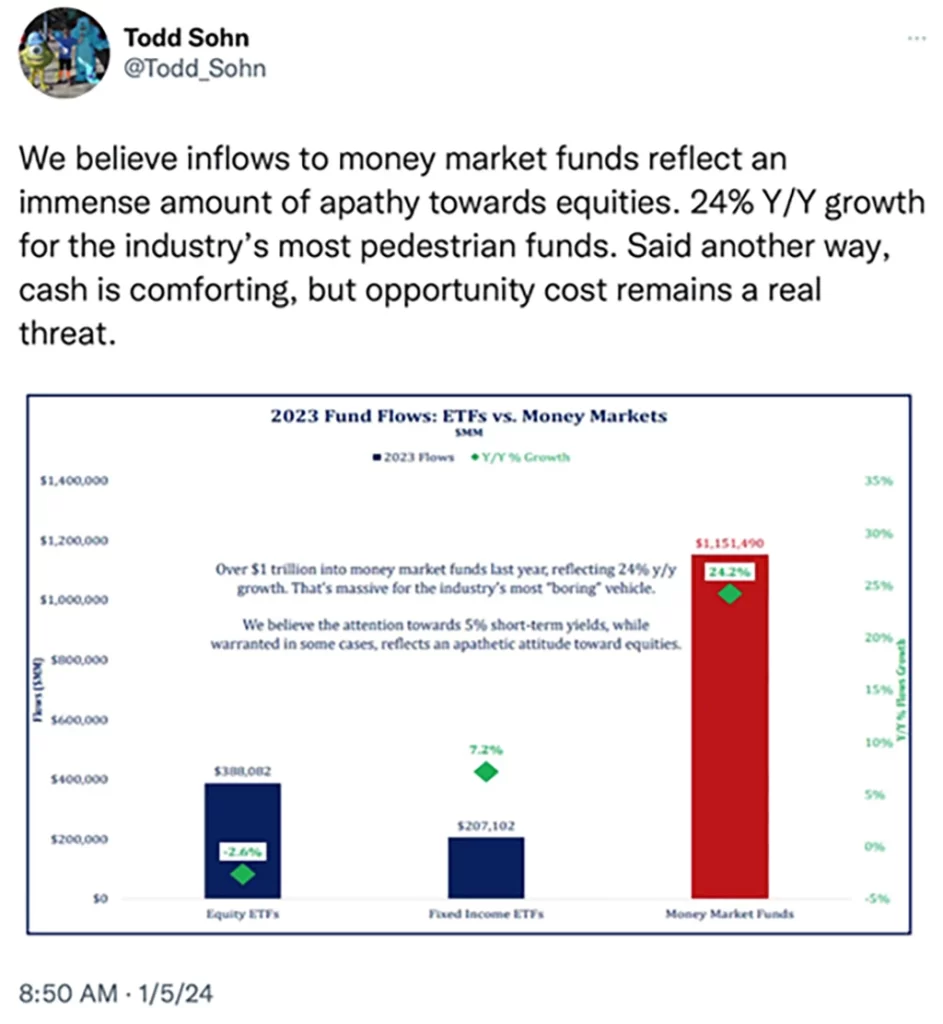
Even with this extreme enthusiasm for stocks, it will likely surprise you that investors continued to pour money into money market funds during 2023. Perhaps it was the specter of earning 4-5% on money market deposits or a fear that the good markets would not or could not hold up. The opportunity costs were high. See the chart below:
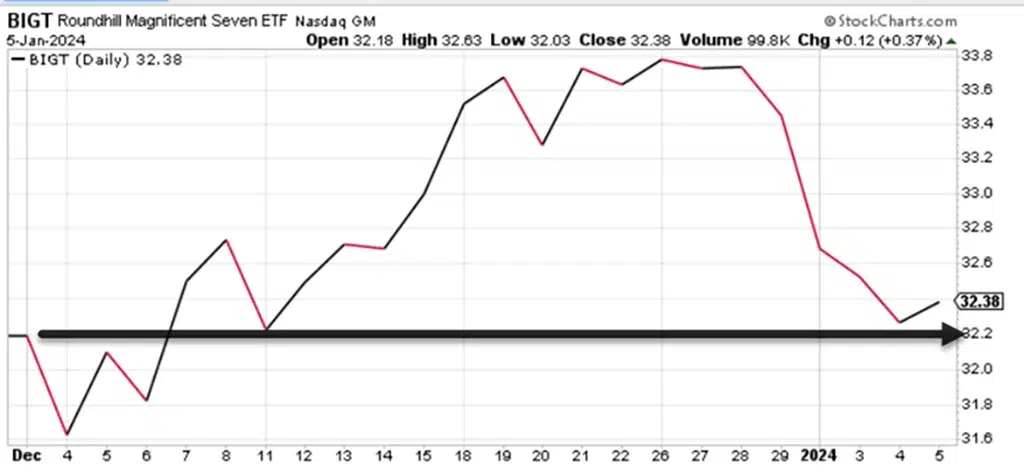
So far in 2024, the Magnificent 7 (AAPL, AMZN, GOOG, MSFT, META, NVDA, TSLA) which account for more than 30% of the S&P 500 index, gave back most, if not all, of the December returns these stocks collectively made. To show this more clearly, we use the BIGT (Magnificent 7 ETF) to show the retracement of December’s gains. See below:
If you are a frequent reader to this column, you may recall two weeks ago I posted 14 “predictions” for 2024. Several of them have started to materialize, although nobody knows if these will continue. Let’s delve into a few:
Use the link below to continue reading about:
- Predication for Value vs Growth stocks
- Expectations for the Healthcare, Biotech and Financial sectors
- What history suggests will follow 9 weekly gains and 20%+ annual gains
- The MarketGauge strategy that could be ideal for 2024 even after 54% gains in 2023
- The Big View Bullets
- Keith’s Weekly Video Market Analysis


