Weekly Market Outlook
By Donn Goodman
February 14, 2023
We welcome you to another weekly Market Outlook. Thanks for being here.
Let’s talk about the really important things now, NEW HIGHS on the S&P 500 index.
Yesterday, the S&P 500 index finished above 5,000 for the first time. We have written several times in recent Market Outlook columns (click here for last week’s column) that the stock market (and individual stocks) like round numbers. They are pulled both up (and down in bad markets) to hit round numbers. It is no surprise that the S&P was “pulled” up to 5,000 and beyond. As we have pointed out in the past few weeks, we had expected it.
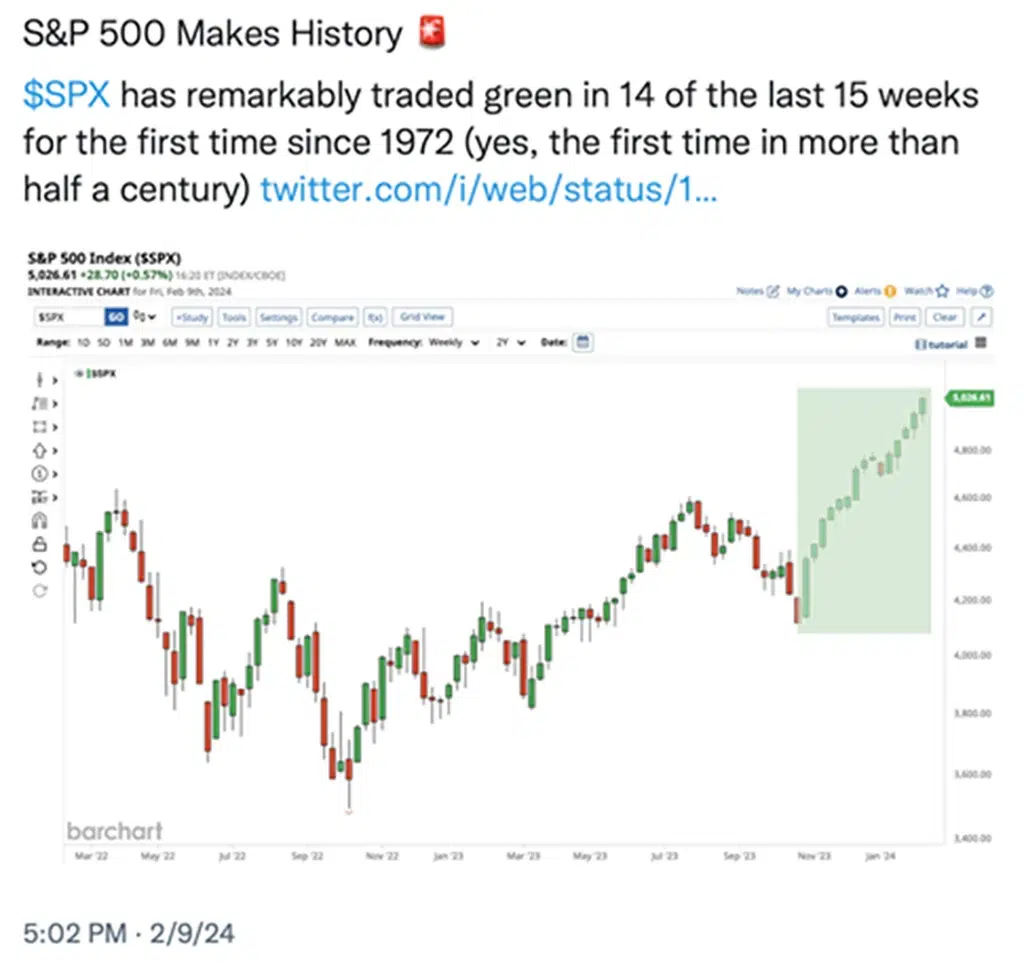
Just as important, the S&P 500 is up 14 of the past 15 weeks, which has not been done since 1972. See charts below:

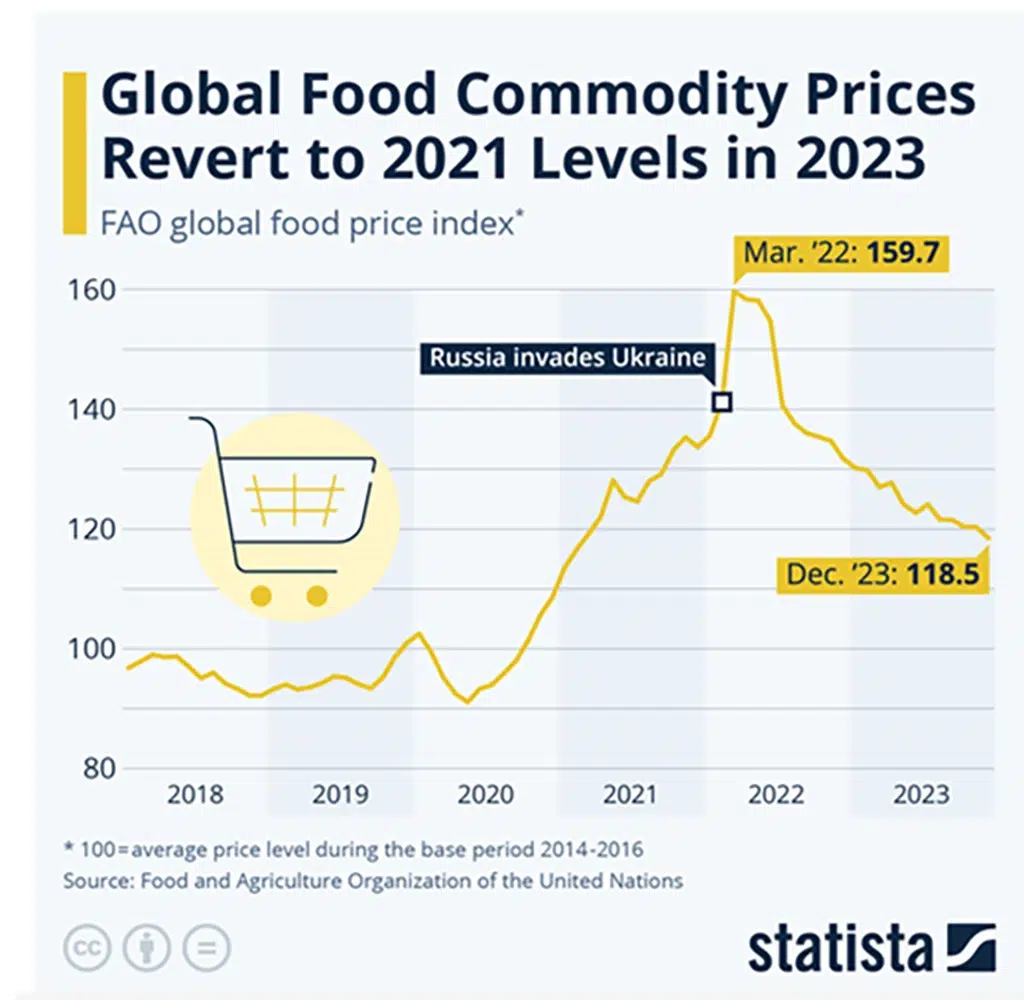
Investors continue to bet on a “soft landing” and a resilient US economy given low unemployment, inflation having come down over the past year and the Federal Reserve’s forecast of several rate cuts during 2024. A positive recent takeaway is that FOOD prices are beginning to come down. This should help ease the burden of the average family having difficulties providing quality food for their families, something we often hear from consumers and surveys about “what is worrying the average worker.” See chart below:

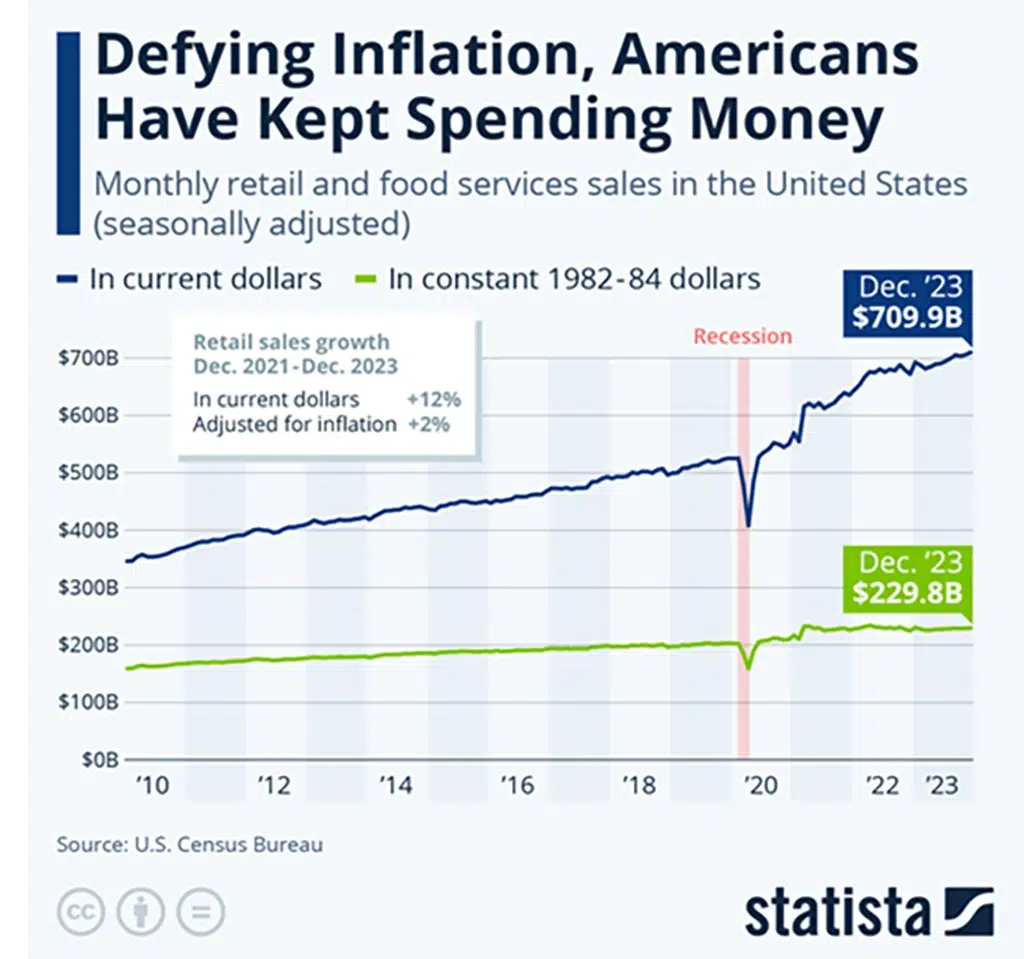
The good news for the economy is that wages have been rising and that shows up in the following chart illustrating that the average consumer keeps spending $:

Despite the 5,000-point milestone, there’s caution that the S&P 500’s 20% rally since early November may hit a roadblock soon. (more on this in a minute).
The Fed kept its main interest rate at a 22-year high for a fourth straight meeting last week, and while officials signaled their openness to cutting them eventually, it won’t happen right away.
“The big driver for the rally is the realization that the US economy is unlikely to falter in the way that the average prognosticator had expected,” said Yung-Yu Ma, chief investment officer at BMO Wealth Management. “A better economy, healthy profits, and lower inflation are providing the fuel.”
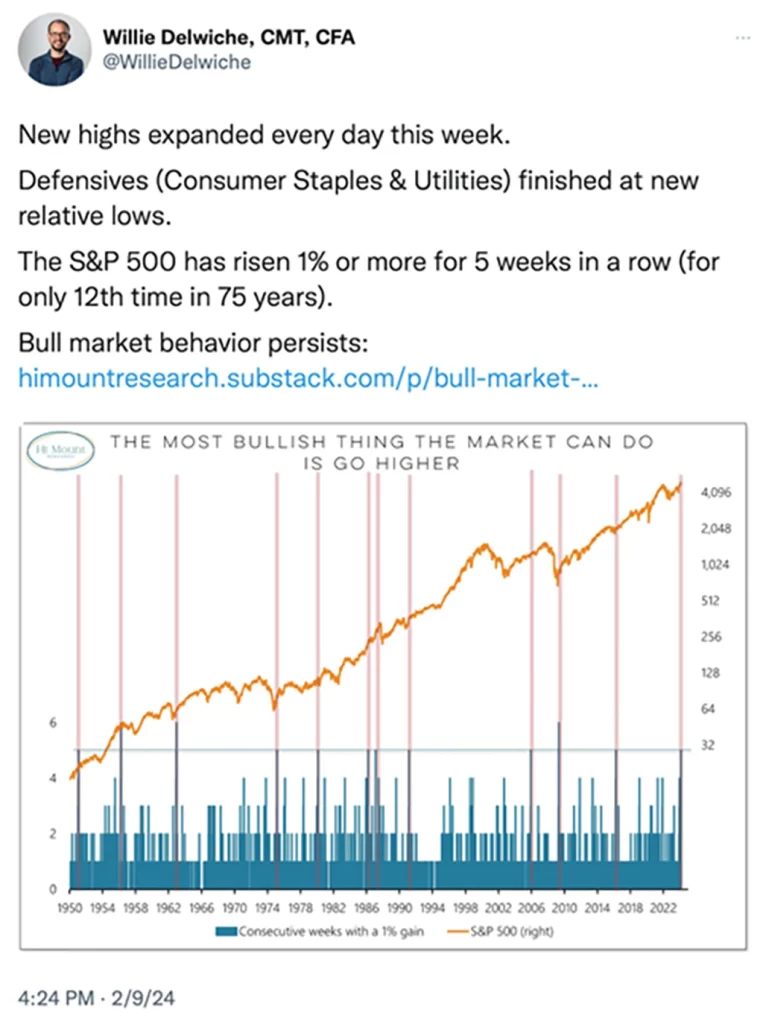
Continued strength in the S&P 500 is making history.
- The S&P 500 closed at a fresh record high this week, gaining +1.37%. It’s only had one negative week since the October lows, rising +22% in that time.
- This was the fifth straight weekly gain of +1% or more. Since 1950, there have only been 11 other five-week streaks of +1% or more.
- The S&P 500 generally continued higher over the next few months, although 1956 and 1987 were notable exceptions.
Additional facts and figures on the S&P 500: (more on several of these shortly)
First Impressions Matter. In the 40 years since WWII when the S&P 500 was up at least 1.5% in January, its median performance for the remainder of the year was a gain of 13.4% with positive returns 82.5% of the time. In all other years, the S&P 500’s median gain was 5.7% with positive returns 66.7% of the time. (Source: Bespoke)
Lights Out. The Technology sector’s weighting in the S&P 500 ticked above 30% on 1/24 for the first time since 9/26/00. On the same day, the Utilities sector saw its weighting in the S&P 500 drop to a multi-decade low of 2.17%. Since 1990, the only time the Utilities sector’s weighting dipped below that level was in late March 2000 at the peak of the Dot Com Bubble. (Source: Bloomberg)
Does Share Price Matter? In the large-cap Russell 1,000, the 100 stocks that began 2024 with the lowest share prices fell an average of 7.4% in January, while the 100 stocks with the highest share prices rose an average of 2.0%. Additionally, the 41 Russell 1,000 stocks that began the year with a $500+ share price rose 3.2% in January, while the 25 sub-$10 stocks fell 11.0%. (Source: Bespoke)
No Breaks. The S&P 500 has now rallied 21.3% over the last 70 trading days without experiencing even a 2% decline from a closing high. Since 1953, there have been 15 other streaks where the index went at least 70 trading days without a 2% decline. One year after those prior 70 trading day periods, the S&P 500 was up an average of 12.7% with gains 87% of the time. (Source: Bespoke)
Earnings Beats are Rallying. 72% of the more than 500 companies that had reported Q4 2023 earnings through February 7th reported stronger than expected EPS compared to a historical EPS “beat” rate of 65% over the last ten years. Stocks that beat EPS estimates have rallied more than 2% on the first trading day following their earnings reports this season, or about 50 basis points more than normal. (Source: Bespoke)

The takeaway: The current rally is beginning to challenge historical extremes, but as the legendary technician Paul Montgomery once said, “The most bullish thing the market can do is go up.”
What happens next?
Use the links below to continue reading about:
- What happens the next six months after the market hits new highs?
- Which sectors of the S&P are currently the strongest?
- Why Technology is by far the strongest sector.
- What are the biggest winners in technology?
- Communications stocks are a close second.
- Keith’s weekly BigView video analysis


