November 29, 2023
Weekly Market Outlook
We hope you had a Happy Thanksgiving, and the holiday spirit continues in the market.
Welcome back Gaugers. We hope that you have had an enjoyable Thanksgiving holiday and have been participating in the positive markets that we have recently experienced.
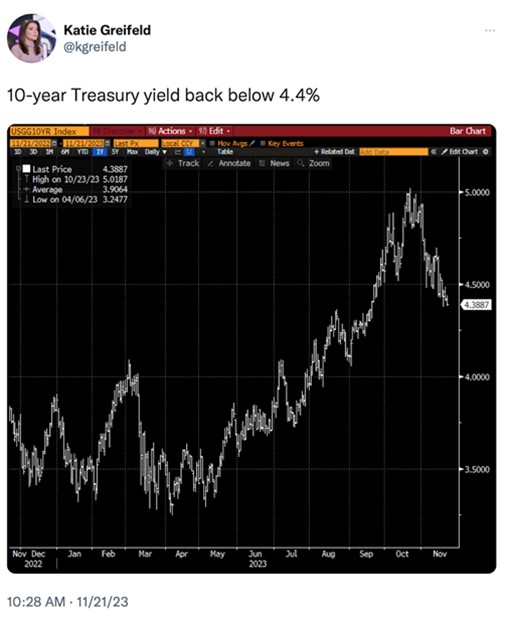
Most major indices finished this holiday shortened week up around 1%. Interest rates have been drifting lower and now we are below 4.5% on the 10-year Treasury. This is a steep decline over the past month after hitting 5% in late October. See chart below:
The above illustration is one of many we want to share with you in this week’s Outlook. The above picture paints a clear story of the 2022-2023 Fed induced hawkish interest rate rise culminating in rates hitting an area (5%) we have not seen since 2007. Right before the GFC (Great Financial Crisis) of 2007-2009.
At some point, higher interest rates begin to impede the forward positive bias of the stock market. It especially hits small-cap stocks (Russell 2000-IWM) and value stocks (VTV) the hardest as these companies are much more interest rate sensitive.
A Deeper Dive
If you are a longtime reader of the weekly Market Outlook, you are well aware that we like to present charts, graphs, and tables in this column. We believe that looking at these provides you the opportunity to see the “whole” picture. As I have repeatedly heard most of my life: “A picture is worth a 1,000 words.”
Looking back as recently as this past month, we see that as soon as investors perceive that the hawkish Federal Reserve appears close to being done raising rates, bond prices rallied and interest rates came down. Much of this was precipitated by weaker economic numbers showing cooling inflation.
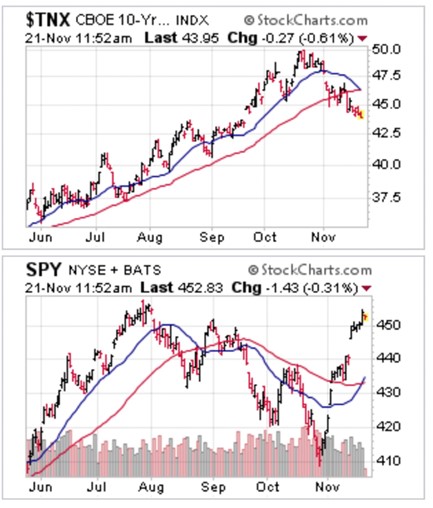
In turn, this set-in motion weakness in the US Dollar and a quick rally in stocks. Here is another chart giving even more of this picture. Look at how closely correlated the decline in interest rates and the rally in the S&P 500 index.
Our view: Interest rates came down fast, perhaps a knee jerk reaction for those who were short bonds or sitting in short-term money market funds and wanted to get reinvested quickly. We remain cautious and believe that rates could climb back up towards 5%. This might wait until early 2024 and might spark a bond market sell-off.
We are skeptical that inflation will continue to keep declining and instead remain on alert for a hiccup in energy, food, and services prices that may stay elevated.
With bonds rallying and the dollar sinking, stocks gapped up from the start of the day Tuesday and put in the second-best daily stock market performance since much earlier in 2023.
See the US Dollar chart below which coincides with this recent rally in risk assets:
Investor Sentiment
We have often pointed out, in previous Market Outlook columns, exactly how important investor sentiment is to drive stock market action, especially upward.
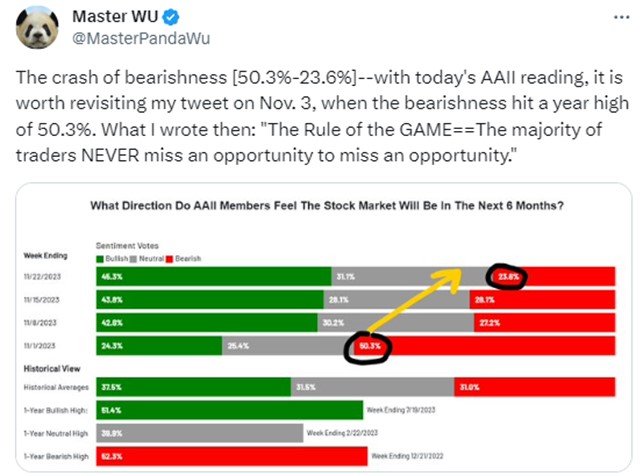
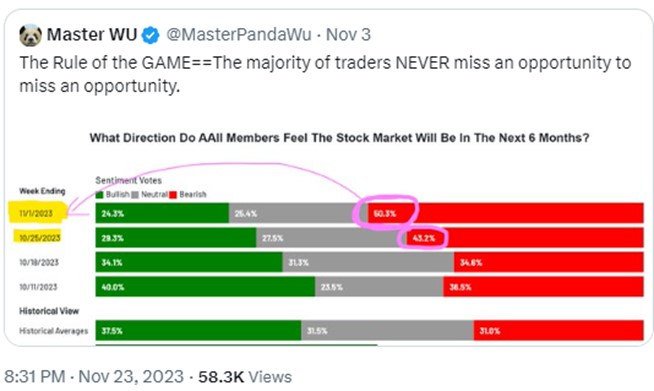
Again, incorporating charts/graphs we want to illustrate the recent and rapid changing investor sentiment readings. We point this out to prove the point that whatever creates a shift in investor sentiment (in this case a Fed pause in hiking rates and interest rates and the US Dollar falling) can set in motion a rapid change in the market’s trend. The charts below are based on the AAII (American Association of Individual Investors) sentiment readings over a 4-week period.
Also, notice the change in sentiment from this same group on their expectations of the stock market for the next 6 months, which has recently become very positive. If you are a contrarian investor, these rapid shifts could be pivotal to taking a “hedged or opposite position.” See below:
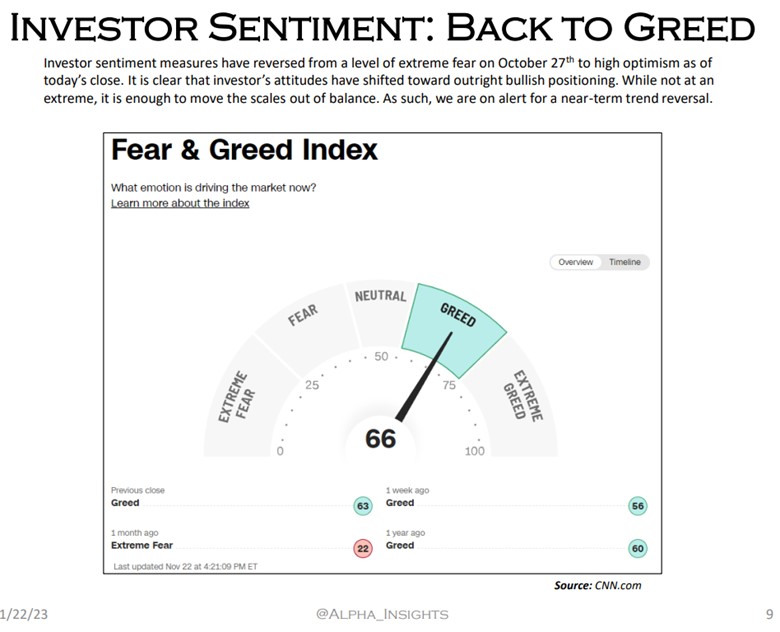
In concert with the above charts and according to the updated Fear/Greed charts provided by our friend (and soon to be contributing member of MarketGauge Pro), Jeff Hugh of Alpha Insights (check his work out at ALPHA INSIGHTS | Investment Strategy (jwhinvestment.com), the CNN indicator below shows we are firmly in the GREED camp again.
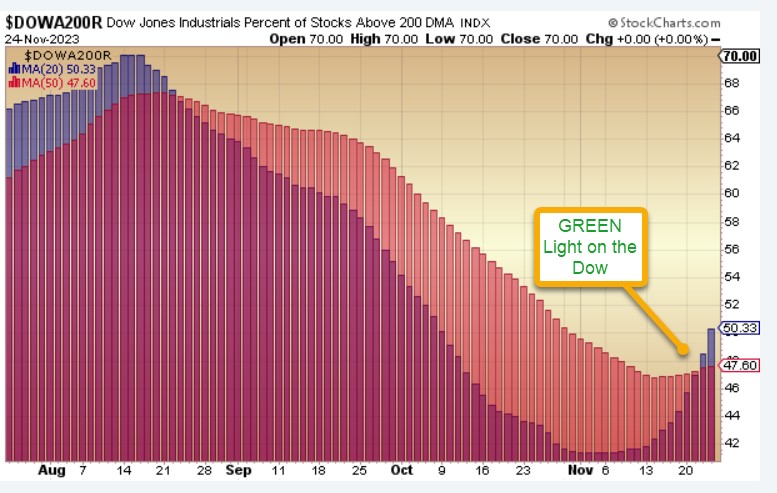
The number of stocks above their 200-day moving averages within different indices have increased significantly and are giving a signal for a sustained “up move.”
We introduced this chart on several occasions in the past and want to provide an update from just a week ago. We now see additional evidence of a confirmed move using the longer-term appreciation of stocks above their 200-day moving averages. This is a positive sign.
(This will be part of the new MarketGauge Pro site and feature the Dow, NDX, NYSE, and S&P 500 stocks above their 20, 50, and 200-day moving averages updated weekly. If you are managing money for clients, this can be a helpful contributor to taking a risk-on or risk-off position).
These charts help navigate the markets and are most helpful in identifying turns in different market segments. See chart below:
The first chart is the Dow Jones Industrial Average:
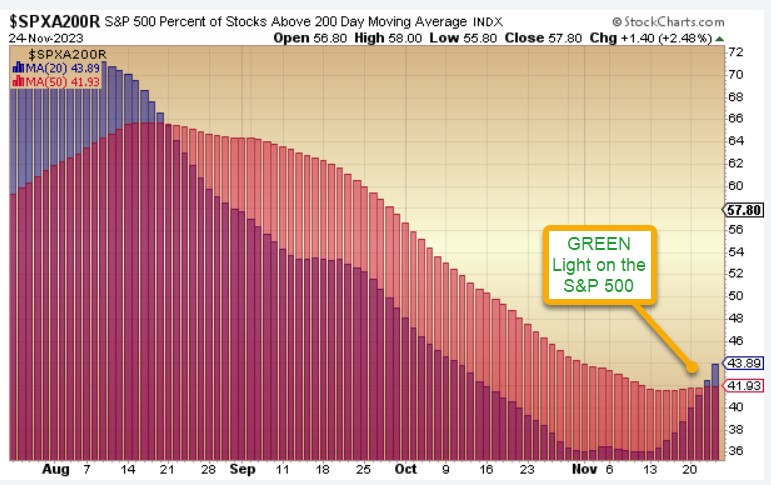
The next chart is the S&P 500 Index:
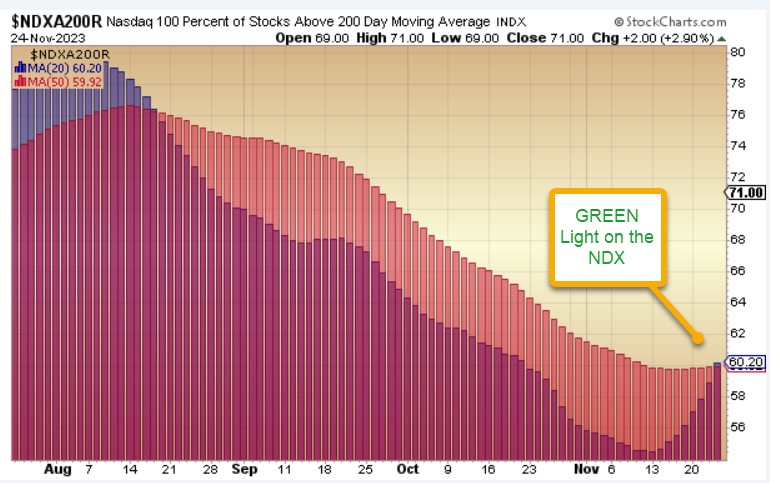
The last chart is the NDX (Nasdaq 100) and like the two above, shows that we have recently gotten a favorable upward bias signal.


