Weekly Market Outlook
By Donn Goodman
March 20, 2023
Fed Chairman Powell faces an increasingly difficult task of managing monetary policy without showing any bias towards either political party in the final months of the election year, but…
There is a much more intriguing race he must also focus on.
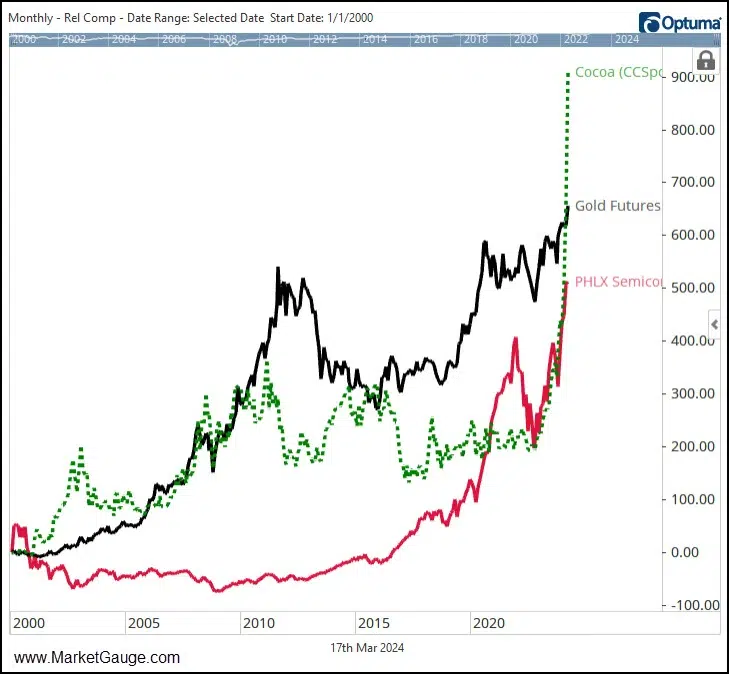
The inflationary race between Semiconductors, Gold, and Cocoa is heating up if not speeding out of control.
This race could be surprisingly important to you if you care about the buying power of your retirement savings!
Consider this…
If, at the turn of the millennium (Jan. 1, 2000), you were given “inside” information from the future that “Artificial Intelligence” would become a reality thanks to new developments in semiconductor technologies by the year 2025, and then asked to lock up your retirement savings in only one of the following three investment options.
What do you think you would have chosen?
- The Semiconductor Index. Using the “index” ensures your investment would survive over time like your other choices had…
- The metal that had first been used as a form of currency in 700 BC (Gold), or
- The seeds from the Theobroma cacao tree, which have been traded since 1500 BC and are currently used as a main ingredient in chocolate (Cocoa).
As you can see from the charts below, it’s a remarkable situation that appears to be getting more heated up with each passing week!

Don’t dismiss this situation as only applicable to well-positioned active investors skilled at managing risk.
This should grab the attention of every investor, even the most conservative, who may seemingly have no interest in trading gold, semiconductor stocks, or esoteric cocoa futures.
As you may already suspect, this week’s article isn’t just about higher prices for gold jewelry, your next purchase of a box of chocolates, or a fancy mocha latte.
It’s about a critical tipping point in interest rates that I’ve been discussing with members at MarketGauge over the last several weeks.
Long-Term Interest Rate Tipping Points
While most investors consider the level of interest rates to be the source of the “tipping points” that move stocks…
We’ve found that the velocity of interest rate changes is equally as reliable as absolute levels at identifying “tipping point” effects on other markets and trends such as stocks, gold, housing, currencies, the economy, etc.
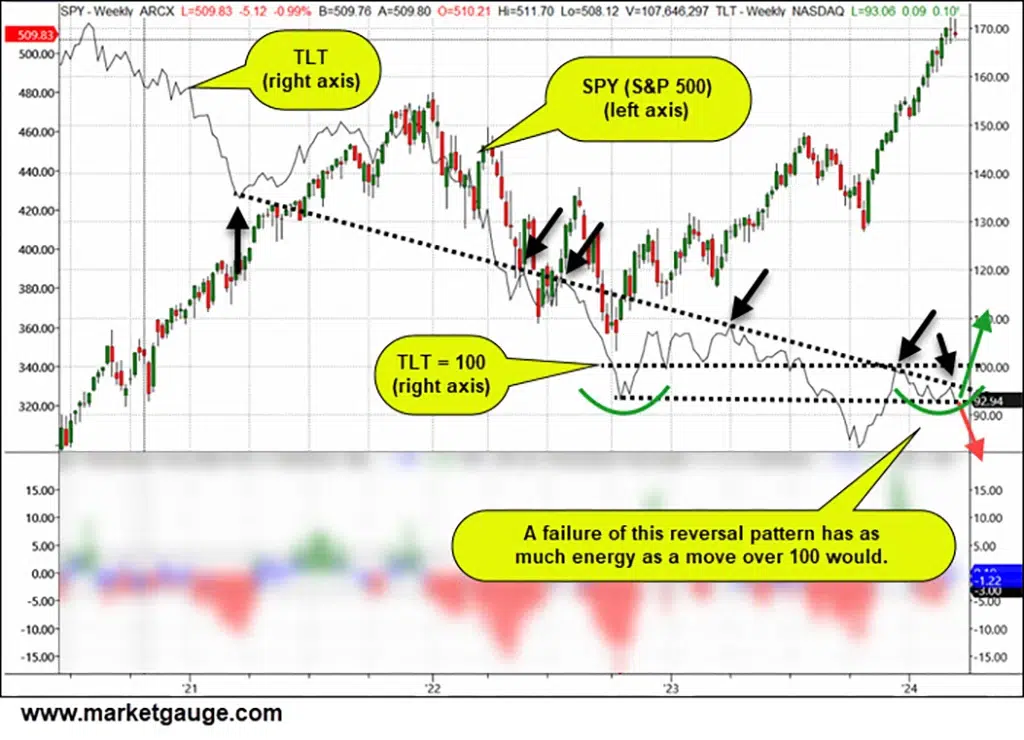
The chart below shows how long-term interest rates, as measured by the TLT ETF, are sitting at a price level and rate of change, which historically has led to a tipping point for a significant move in both bonds and stocks.
Let’s begin with the pattern that has developed in the TLT over the last 2+ years around absolute levels.

The pattern annotated by the green arcs and dashed horizontal line at $93 is a simple technical reversal pattern with many different names.
It will likely be labeled by many as a head and shoulders bottom if it resolves itself to the upside by breaking above the impressive 6-point trend line and equally significant horizontal line at $100.
What’s not shown on this chart is that such a break higher would also take out a 200-day moving average and confirm a bullish momentum divergence pattern in our Real Motion indicator.
In short, a move over 100 in TLT could lead to a surprisingly big move higher in bonds, and LOWER in interest rates.
However, a pattern as coiled as this one has the potential to be equally as volatile if it “fails” or breaks down.
In fact, the “head and shoulders” pattern doesn’t completely exist until it moves higher, but this is a very clear inflection point pattern that we follow on any time frame at MarketGauge, and in this case…
The resolution of this pattern will likely have big implications for gold, technology stocks, the broader stock market, and, of course, interest rates.
So, to anticipate which way the pattern in TLT is likely to break, I looked into the velocity of the recent action in interest rates and a very timely and interesting leading indicator, which I’ve called “The DBA+DBE Inflation Index.”
The current condition of this indicator could have allowed me the creative license to title this week’s Market Outlook…
“Will A Drought In West Africa Crash What’s Left of The Magnificent 7?”
What follows is an interesting example of how and why “unsuspecting linkages and consequences” can surprise investors who don’t stay open-minded and listen to the wisdom of the crowd as shared through the patterns in the charts.
Click here to keep reading about:
- Which way TLT may break based on the velocity in its chart pattern
- Why the weather in West Africa and cocoa matters to the stock market
- The Big View bullets
- Keith’s weekly video market analysis.
- And more


