Weekly Market Outlook
By Donn Goodman
January 24, 2023
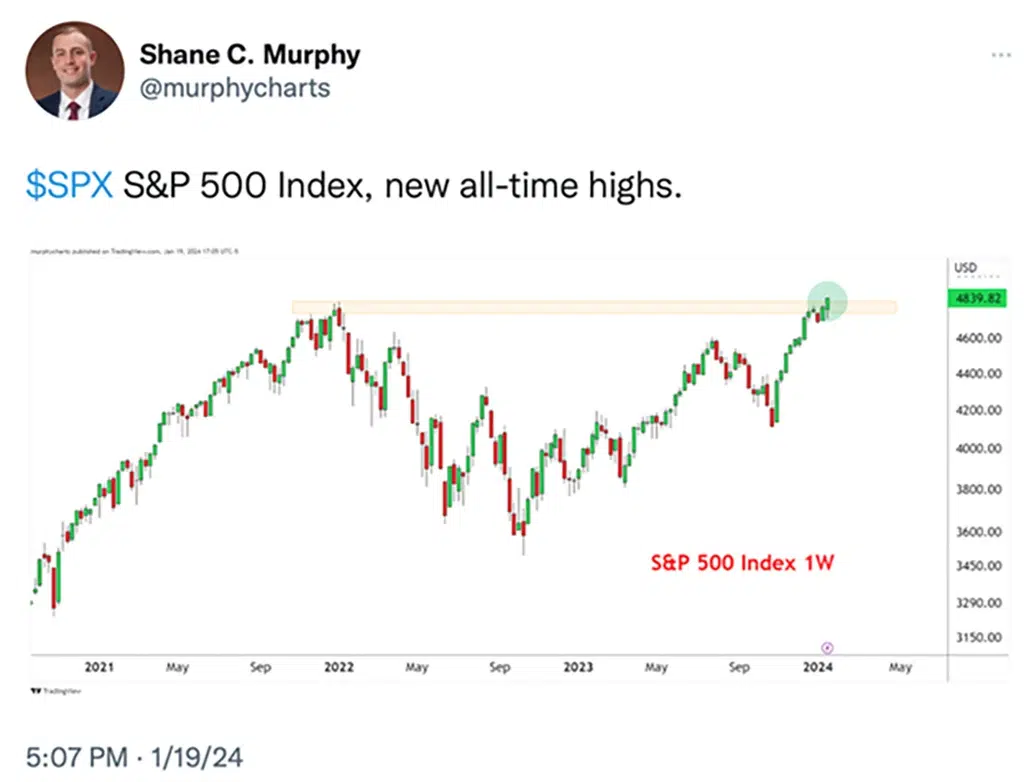
It’s Official! The S&P 500 printed its first all-time high in two years on Friday.
It took 511 trading days, and the S&P 500 fell as much as -25% during that time. It was the longest drawdown since the Great Financial Crisis and the 6th longest since 1950.
It’s often said that trends correct through either time (511 days) or price (-25%), but this time, it was both. Thus, it emerges from a two-year base that took the price nowhere (if you owned the cap-weighted index), but now the bulls must defend the prior highs at 4800 to avoid a failed breakout. See illustrations of the S&P 500 below: ow the bulls must defend the prior highs at 4800 to avoid a failed breakout. See illustrations of the S&P 500 below:
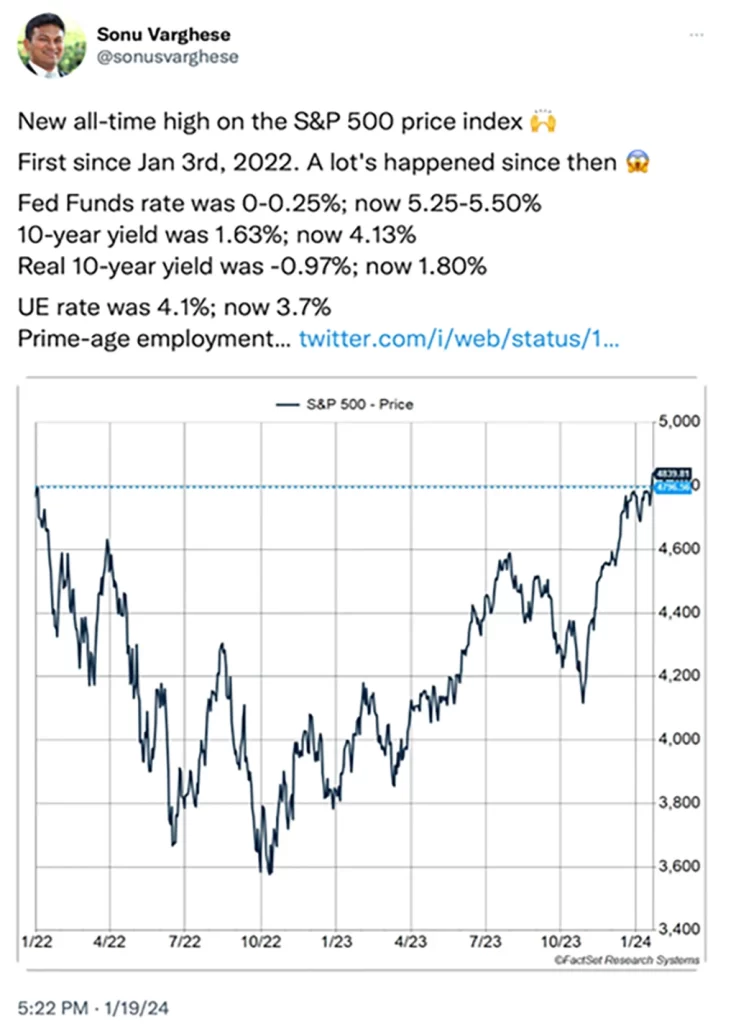
And what exactly did the financial condition look like back in early 2022 when the S&P 500 last hit a new high? See the chart with some comparisons below:
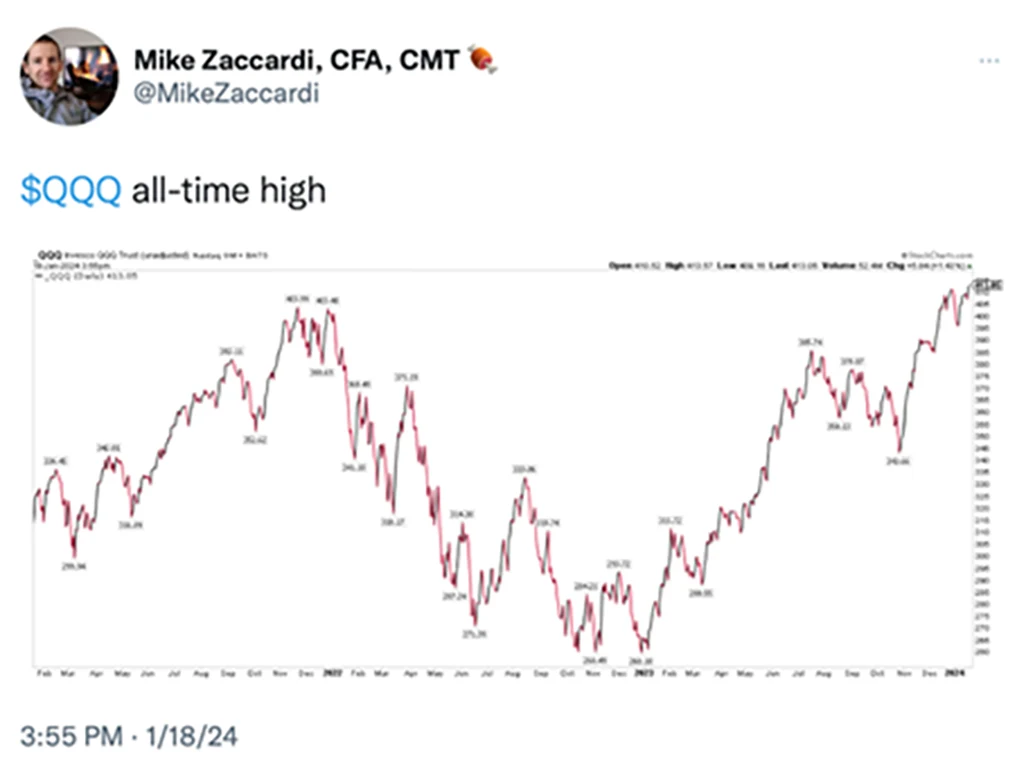
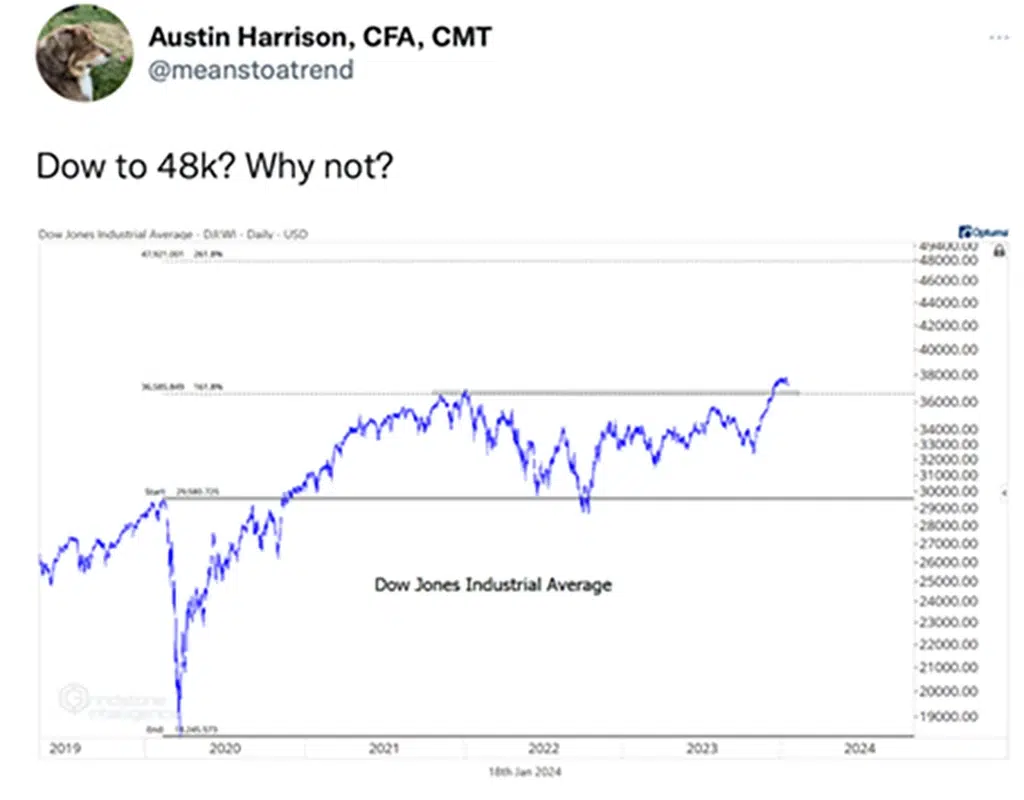
The S&P 500 index was not the only market that saw new highs. See additional market charts below:
Why should we care about new highs in these markets (and many stocks within each market)?
Once price enters uncharted territory, there’s virtually no price memory or overhead supply to prevent it from trending higher. It is why most analysts believe that when markets (or stocks) hit new highs, they have a propensity to move higher. Momentum typically yields more upside, especially if the market or stock is in new territory.
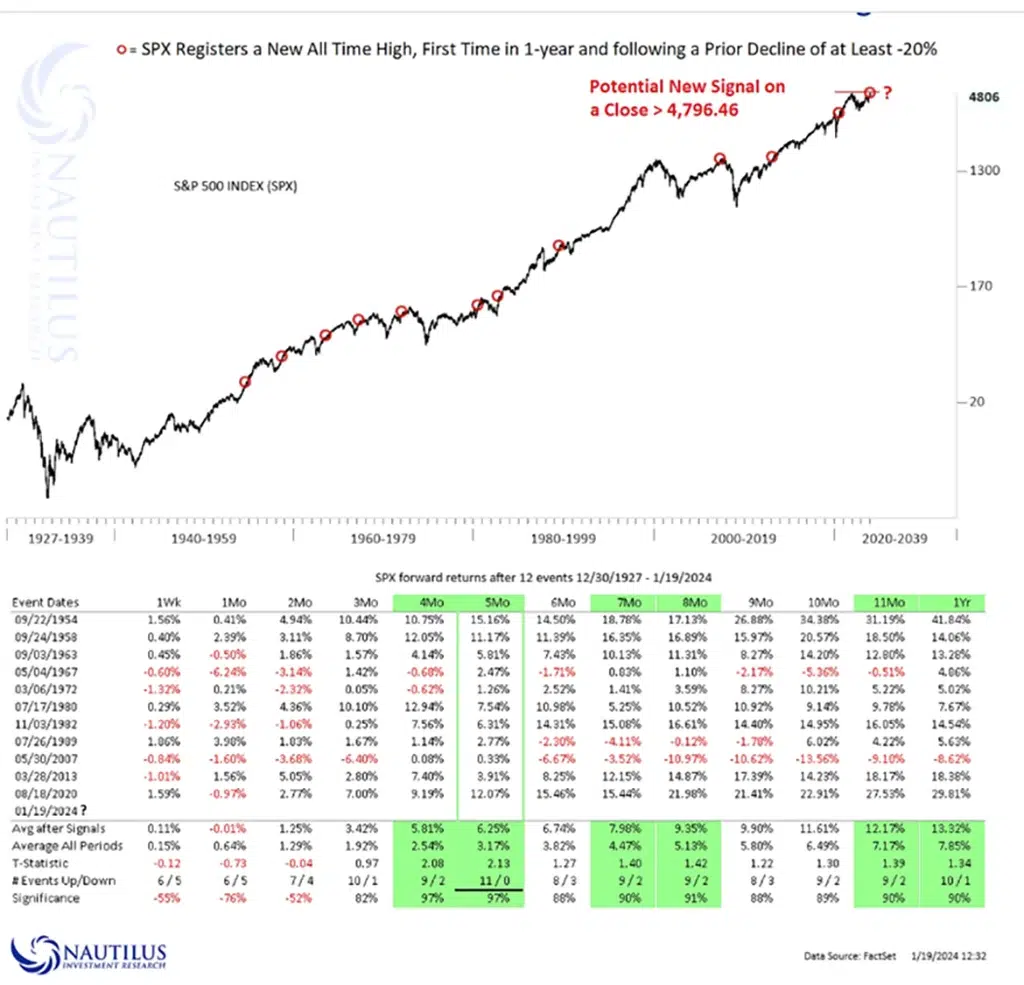
Looking back in history, there have been 11 similar instances of new all-time highs following bear markets, defined by prior declines of at least -20%. The table below provides a comprehensive overview of the expected return profiles associated with this study, done by Nautilus Research.
It is important to note that while continued upward momentum is typically observed, returns in the 1-week to 2-month range can be mixed. In the case of 2007, it essentially marked a ‘double top,’ but in the other 10 instances, strong returns were witnessed from 5 months up to 1 year forward.
Last week we provided three different scenarios that could play out in the economy this year and the potential impact these scenarios could have on the stock markets. If you haven’t read last week’s Market Outlook and would like to review those three scenarios, please click here.
Broadening Out.
Even though the S&P 500 has demonstrated over the past few months that it is broadening out, the discrepancy between the cap weighted S&P 500 index and the equal weighted S&P 500 index (RSP) is big. See chart showing the difference below:
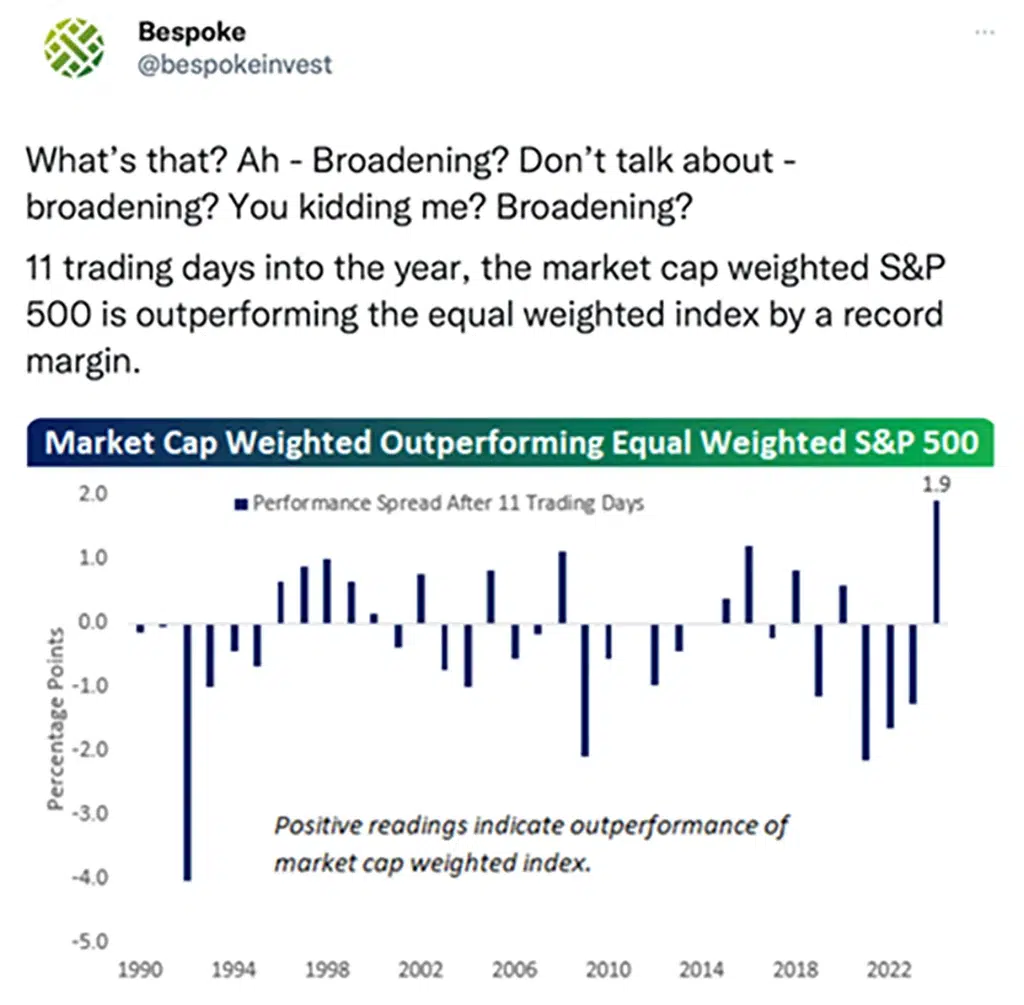
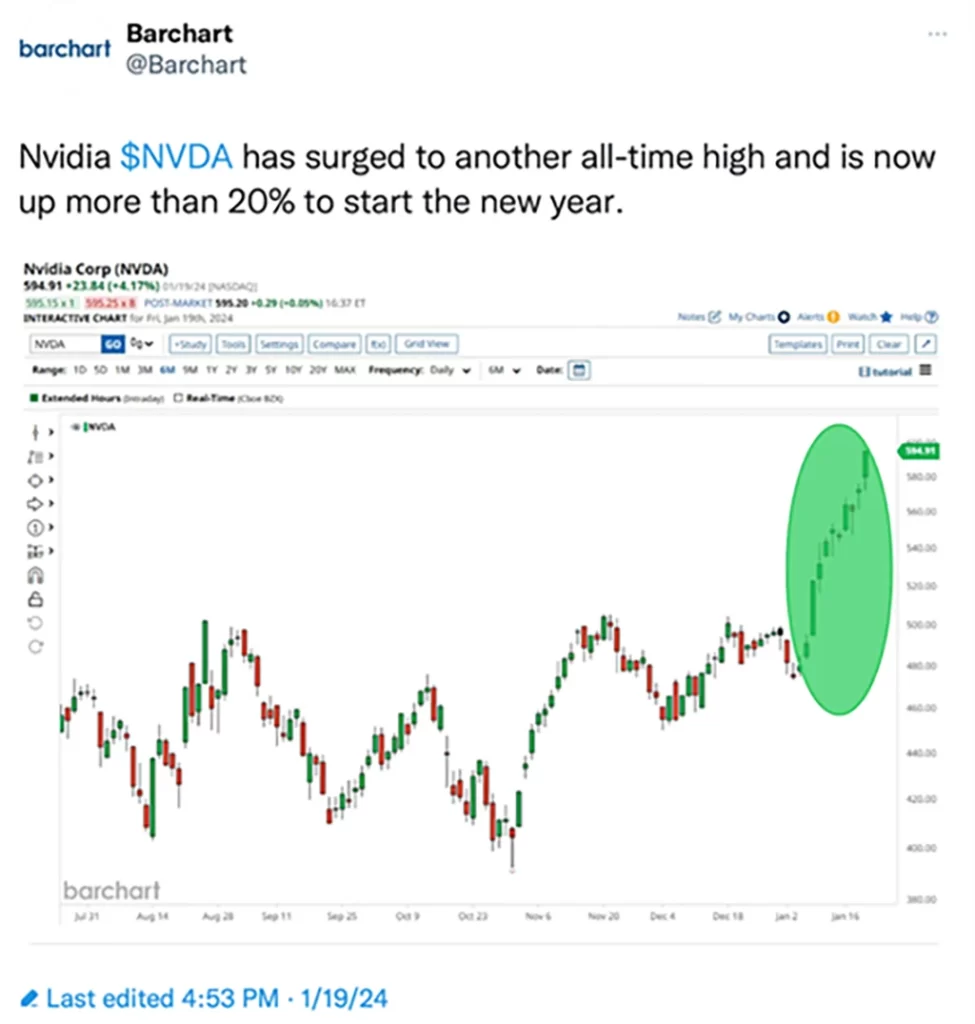
This continues to prove that significant inflows have been going into the index fund (SPY) and last year’s leaders. Therefore, capital continues to flow into the Magnificent 7 stocks which currently comprise 30% or more of the S&P 500 index. One stock, Nvdia (NVDA) is already up over 20% for 2024. See chart below:
Use the link below to continue reading about:
- Positive technical indicators on the S&P 500.
- Similar positive indicator for a leading company using Artificial Intelligence.
- Money is in rotation. See what sectors are benefiting.
- Mixed signals that could influence the Federal Reserve lowering rates.
- Historical market comparisons. What might happen in 2024?
- The Big View bullets. What parts of the market are showing the most strength?


