Weekly Market Outlook
By Donn Goodman
MarketGauge Pro
June 19, 2023
Welcome back loyal readers. Glad to have you with us.
We consider those of you who follow us and use our investment tools, models and useful trading ideas to be among our own All-Stars Winners! And we appreciate you!
We also want to celebrate the hard working, dedicated fathers that follow us. You are also our All-Star Winners. We wish you a belated Happy Father’s Day. Your families are blessed to have you. We wish you an enjoyable and relaxing Father’s Day. To your family and friends, you are their All Stars. Keep it up.
This week’s economic backdrop.
It was an interesting week that began with updated inflation (CPI) news. A flat monthly number (year-over-year unchanged at 3.3% inflation rate) helped prompt a drop in the 10-year yield and fuel enthusiasm that we may see an early fall (September) rate cut.
Couple that with dovish rhetoric from the Federal Reserve midweek, and the odds of seeing such a cut as early as September appear to have increased to a better than 60% chance.
This writer is not so sure and remains skeptical. The mantra “higher for longer” remains. While it is certainly possible that a rate cut comes sooner than later, we still believe that the data dependent Fed will not see enough signs of a slowing economy until well into the fall. We would welcome a rate cut but our belief is that the Fed may wait until after the election and not act until year end.
While the monthly number may have been flat, Inflation continues to be elevated on an annual basis, and there are signs that food costs along with insurance costs (which affect every American) are still increasing, and those are important components of CPI (and PPI) which will put pressure on near-term inflation numbers.
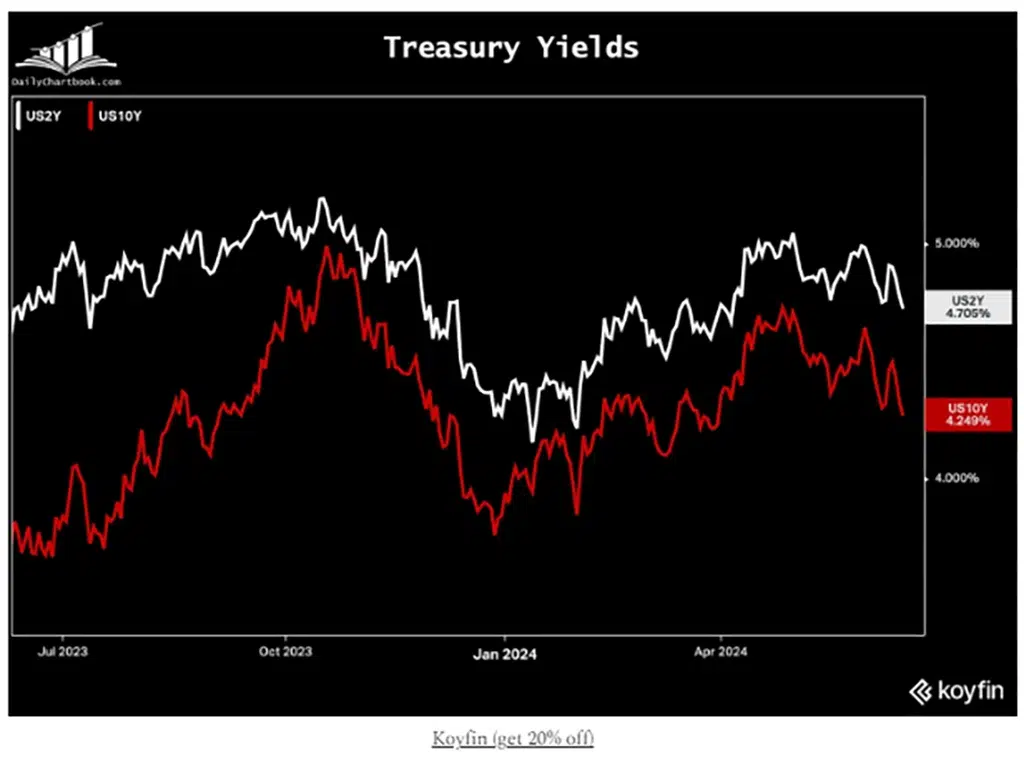
Due to the perception that the month over month inflation numbers within the CPI were flat and inflation is trending down, the bond market rallied this past week. See chart below:
Yields. Positive data on inflation drove yields on 2-year and 10-year Treasuries to the lowest since early April and late March, respectively.

Whether it is sports, business or life, All-Stars play a pivotal role.
Like a lot of you, I am an avid sports fan. I enjoy being a spectator of a number of professional and amateur sports. My son played Lacrosse during his high school years, and I really enjoyed watching the sport. Fast, action packed and never a dull moment.
As a Cleveland sports fan most of my interest lies in our three professional sports teams, the Browns, the Cavs and the Guardians (formerly the Indians). Additionally, I am a fan of college football and basketball. I never grow tired of watching an exciting game.
I now understand why attracting and keeping the All-Stars is so important. No matter what sport, it is usually the All-Star players that propel the team to get to and participate in the quest for a championship.
Without LeBron James, there is no way that the CAVS would have won the NBA Championship several years ago. The same goes for the Patriots with Tom Brady or the Chiefs with Patrick Mahomes. I don’t remember too many teams competing and winning the whole thing without 1 or 2 All-Stars. Certainly, the Boston Celtics are not the same team in the current NBA finals without their All-Stars, Jason Tatum and Jaylen Brown.
The stock market is not too different.
I worked for 24 years with a large-cap stock investment manager headquartered in New York. The firm manages billions of dollars in one equity investment portfolio made up of approximately 45 stocks. It was always approximately 10% – 20% of the portfolio that fueled most of the yearly gains. Each year it was the All-Stars in the portfolio that fueled the most positive performance of the total portfolio.
So why own so many stocks?
Most investment managers choose to be overly diversified, not knowing which stocks will be this year’s All-Stars. That is also why most, if not all, money managers only produce returns close to the benchmarks/indices that they choose to replicate.
I thought there was a better way. And there is.
One of the major reasons I was attracted to working at MarketGauge is because of the quant driven investment models where the proven algorithms can select what might be the next All-Stars and then position the assets in these stocks or ETFs. That is why our concentrated portfolio methodology over time works better.
Also, by utilizing risk management tools, each portfolio is uniquely positioned to exploit its All-Stars and take advantage of intermediate to longer-term trends. Each model has a different investment edge so that when blended together (in our MG All-Weather Portfolios), multiple strategies usually produce smoother performance outcomes.
If you are not yet aware of our various investment models, please contact us (Rob@MarketGauge.com or www.marketgauge.com/call) to review our different stock and ETF investment models. These models use concentration in individual stocks and/or sectors as a strength and manage the risk of concentration better than the “old school” approach which is to diversify into more positions.
As just one example, our ETF Sector Plus has been invested in semiconductors for a long period (since mid-2023) and our individual stock programs have owned Nvidia off and on since early last year.
We are rolling out a new NASDAQ investment strategy called “NQ3” that has been back-tested using a different algorithm methodology than our other investment strategies. This 3 stock portfolio owns the BEST ALL-STARS and has demonstrated a propensity to capture significant gains from owning the best of the best All-Stars. Back-tested results show an annual return of greater than 35% on this portfolio.
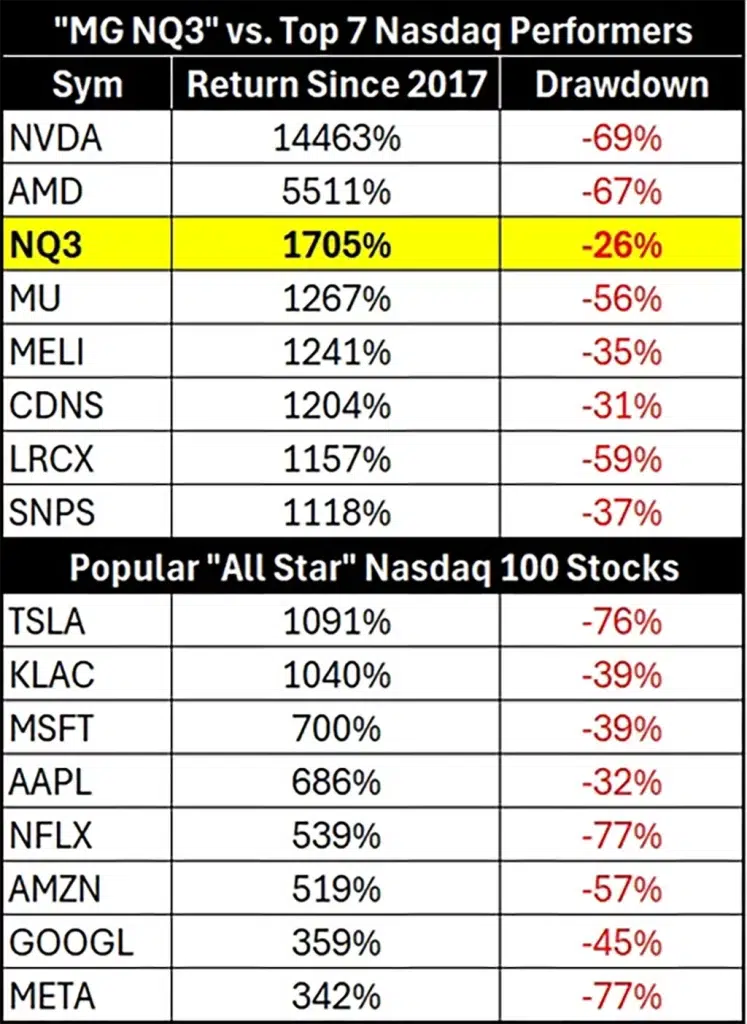
As the All Stars change, so does MarketGauge’s NQ3 portfolio. The table below illustrates the top 7 performing Nasdaq 100 stocks, and the “popular Nasdaq All All Star stocks” since 2017.
These two groups of All Stars are ranked by performance since 2017. MarketGauge’s NQ3 model would rank #3 in performance among them.
To our point above about managing risk, the max drawdown is also listed. This is the equivalent of the biggest “bear market” correction that an investor would have experienced to achieve the returns. On this basis, the NQ3 system is clearly #1 with the lowest max drawdown.
Not shown here is the fact that the QQQ’s performance would be a 295% return with a max drawdown of -36%.

Don't Get The Weekly Newsletter? Join Here:
One message illustrated here is that embracing the market’s All Stars can give you a real investing edge when you manage risk to mitigate the All Stars’ inherent volatility.
Another message, not explicitly shown here, is that All Stars often outperform in down years. This was the case in 2022’s bear market and 2018’s flat market.
After a 66% return last year, this investment strategy is currently up (real-time, real dollars) 33% year-to-date.
If you would like more information on this strategy, there is a webinar replay here (for a limited time). If you’d like to speak to someone about All Star based strategies, please reach out to Rob Quinn, Chief Market Strategist via www.marketgauge.com/call or Rob@MarketGauge.com.
The S&P 500 is driven by All-Stars too.
Whether it is our successful investment models or just owning an index fund like the S&P 500, a small group of stocks usually inevitably drives performance. This is especially true when evaluating an index like the S&P 500, which is capitalization weighted. As a result, the bigger the company, the larger its weighting in the index.
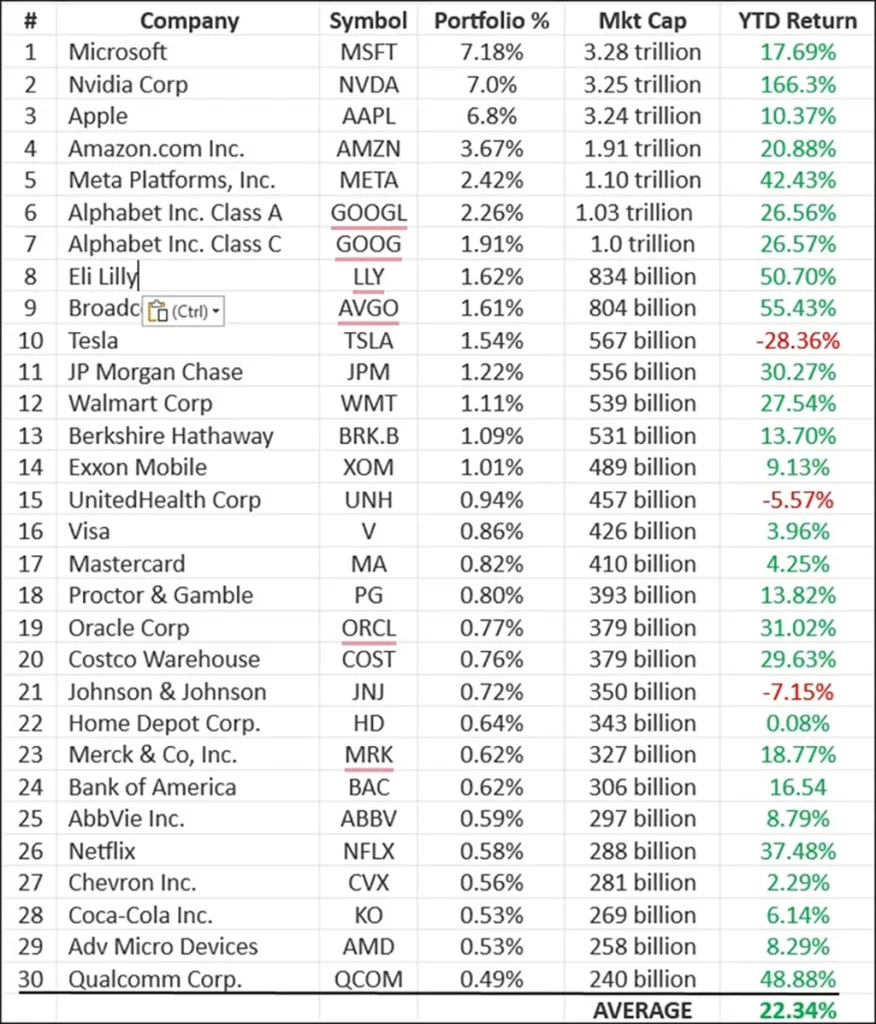
Let’s take a look at the S&P 500 All-Stars and what is currently driving the index year-to-date performance which is up as of the close on Friday approximately 14.1%. Below, we have provided the top 30 stocks, by weighting (portfolio %) that make up the S&P 500.
While there are 500 stocks in the S&P 500, these 30 stocks comprise approximately 51% of the weighting of the index. We have provided the company, the current % of the S&P 500 that each stock comprises, their current Market Cap and the stock’s YTD return from the close on Friday June 15, 2024.

How All-Stars, Semiconductors, and AI determine the market’s performance
Four of the top 30 stocks are directly involved in semiconductor manufacturing (NVDA, AVGO, AMD & QCOM). If you add Apple and Google, both companies that manufacture their own chips as well, there are 7 of the top 30 companies involved in semiconductors.
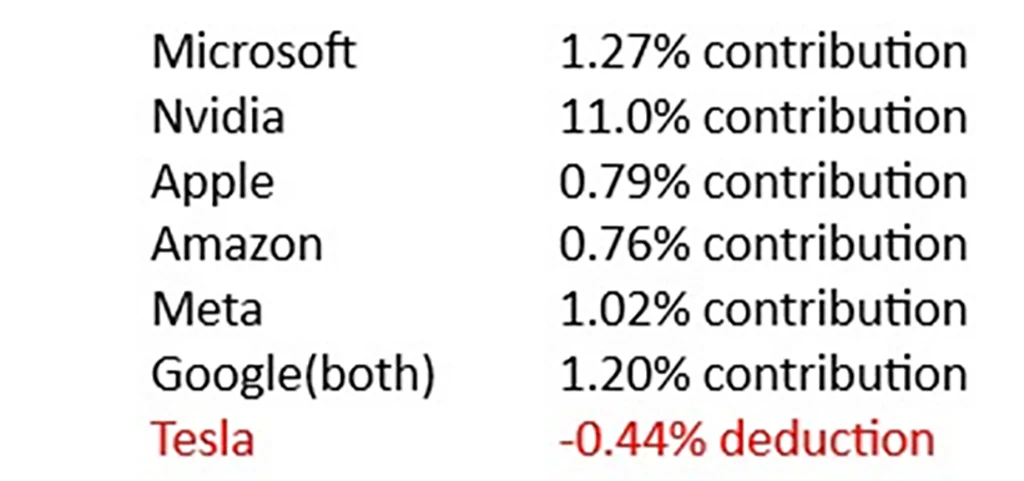
Also, if you factor in that Nvidia is up 166% and makes up more than 7% of the cap weighted S&P 500, that means that Nvidia alone is responsible for 11% of the S&P 500 return of 14.1%. Hard to believe that one stock is responsible for the majority of the index return YTD.
This is also why this past week most stocks in the S&P 500 were down, but because Nvidia was up each day along with a few other mega cap stocks like Microsoft or Apple, the S&P closed higher.
We provided the contribution (and Tesla’s negative contribution) to the S&P 500 return below to give you some added perspective of the All Stars leading the way!

In essence, if you owned the top 7 stocks of the S&P 500 above, your return would be equal to or greater than the S&P 500 index year-to-date. This is because many of the remaining 493 stocks have contributed little to no positive or negative returns YTD. The stocks below the top 50 have such small weightings that their collective returns are approximately equal to the top 7 stocks. This is a proper description of the power of All-Star Investing.
Consider that the top 7 companies by market cap in the above list (of the 500 that make up the S&P 500) are all involved in Artificial Intelligence, and that is all you need to know to understand anything AI is now being rewarded through major stock price appreciation.
The biggest All-Stars right now are about Semiconductors and Artificial Intelligence (AI).
Click the link below to continue reading about:
- The All Stars within the S&P 500
- Record equity inflows
- Exceeding analysts’ projections
- Earnings expectations
- The Wealth Effect
- The Big View Bullets
- Keith’s weekly market analysis videos


