Weekly Market Outlook
By Donn Goodman
April 03, 2023
All of us at MarketGauge hope that you and your families enjoyed an extended holiday weekend and you were able to participate in this season of renewal. We wish you and your families a warm Spring and a profitable upcoming second quarter of 2024.
We will jump right into this Market Outlook by conveying the obvious… what a positive and profitable month of March and first quarter 2024 it has been (unless you are a doom and gloom newsletter writer or a major short-selling hedge fund)
If you have time, please go back and revisit our recent Market Outlook columns in the Big View section of your subscriptions to see just how many times since late last year we suggested you take a bullish bias towards the stock market along with numerous charts showing that buying at new all-time highs historically has led to more gains and additional new all-time highs.
When the market hit its first few new all-time highs, we began to also convey that it was a good time to buy the market. Most of our individual strategies have stayed fully invested during this time, helping our followers to profit from the continuing trends in the markets.
We have now witnessed 21 new all-time highs in the S&P 500. Today, we would like to illustrate where many of the gains during the month of March and the first quarter of 2024 have emanated from. Then, take you through a few charts and narrative about what we might expect for the remainder of the year.
The S&P 500 Index
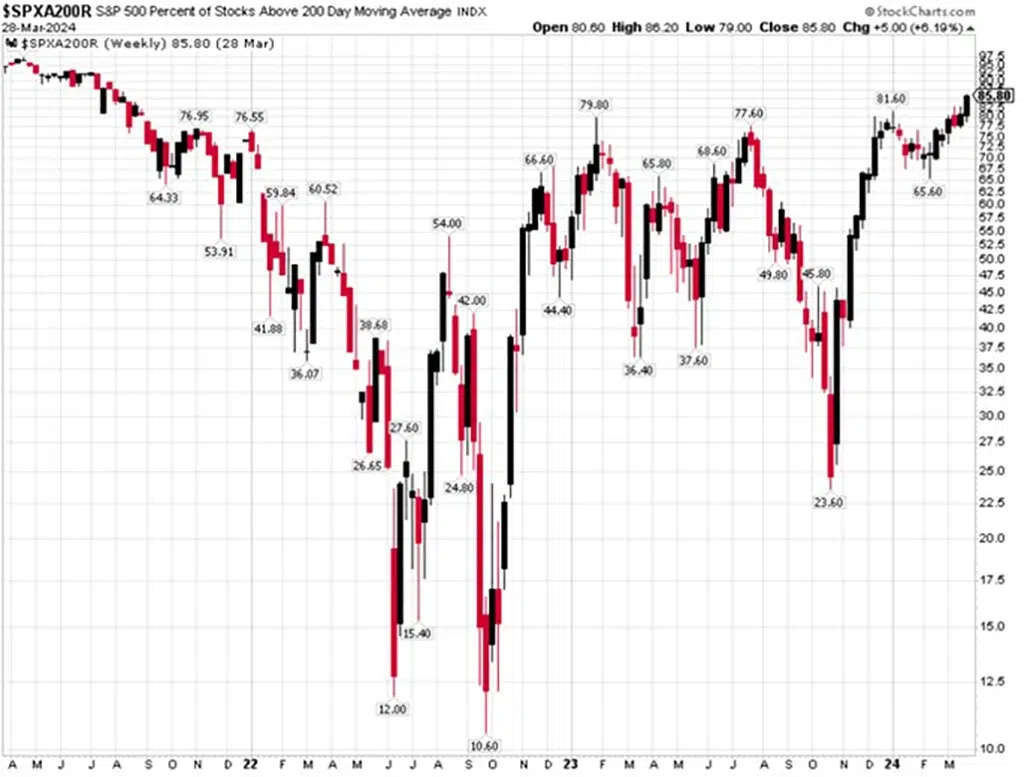
Thursday, the S&P 500 closed at yet another record high, concluding a positive week, month and quarter. As of Thursday’s close, 86% of the S&P 500 stocks are above their 200-day moving averages, marking the first weekly close above 80% since August 2021. See chart below:
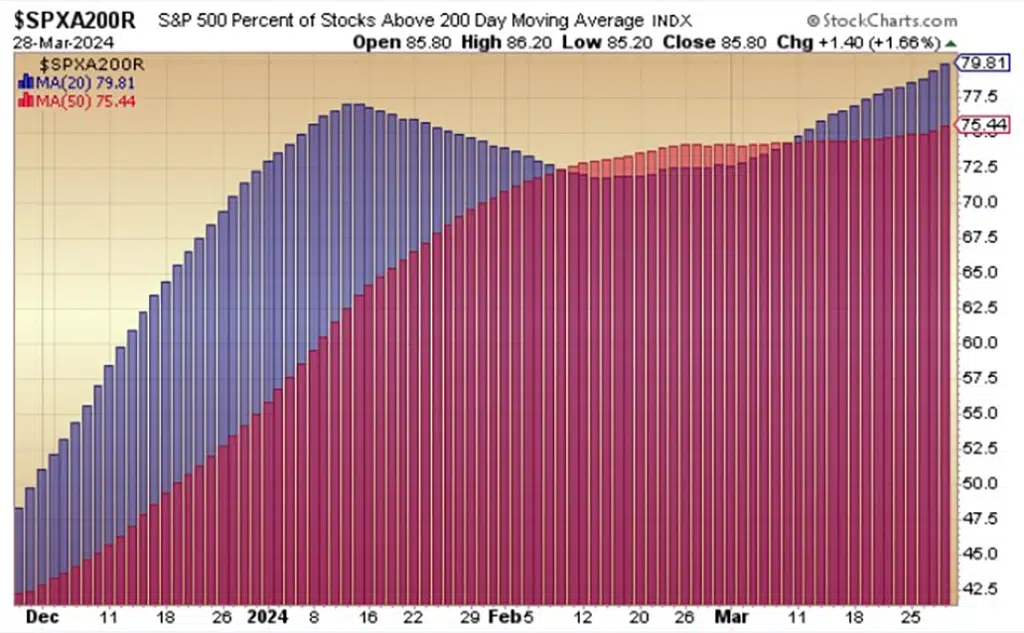
Our own proprietary chart that applies moving averages on the expanding or contracting # of stocks above the 200-day moving average within the S&P 500 showed weakness in early February and then picked up momentum in early March and currently shows a GREEN light and positive bias heading into the second quarter of 2024. See chart below:
Grant Hawkridge below points out that when breadth returns to healthy levels (80%) after a washout, it often stays elevated for several months or even years before deteriorating.
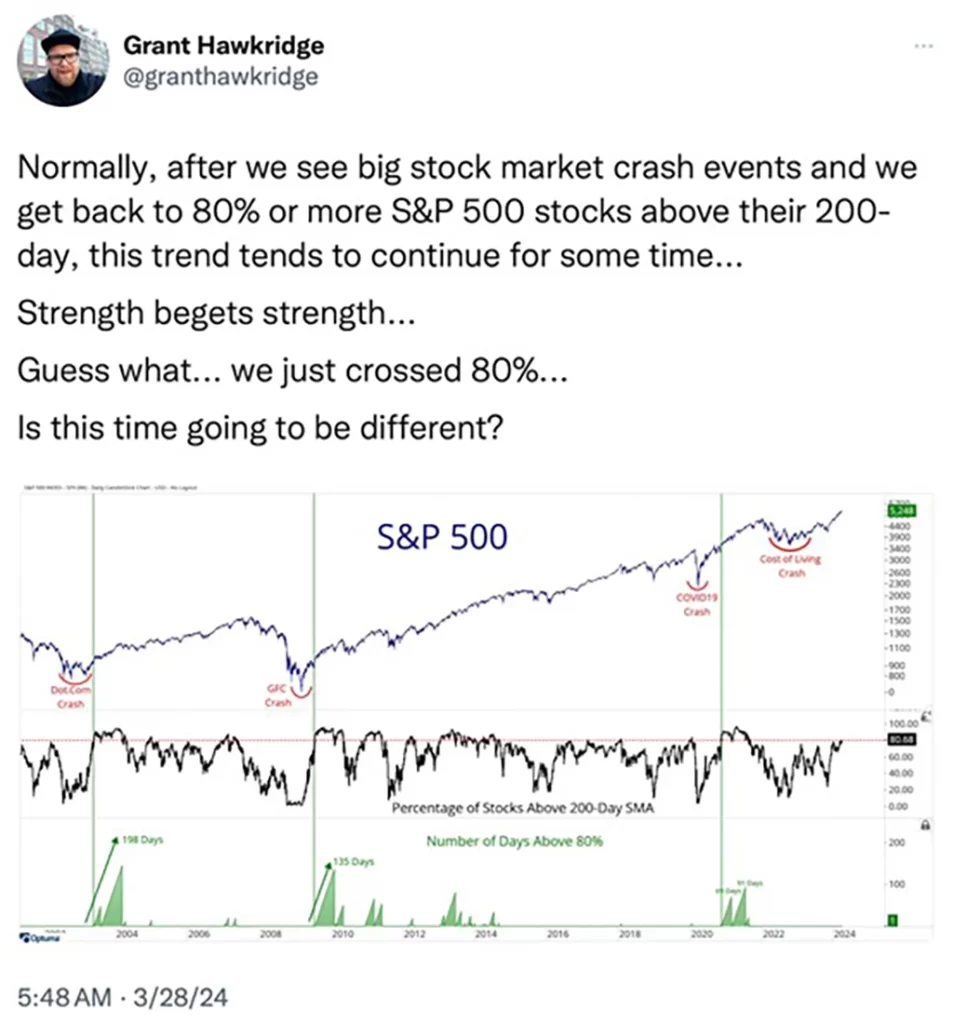
The takeaway: The S&P 500 survived on narrow breadth, but it could really thrive now that more stocks are participating.
Major Market Index Performance
To convey just how good the market’s performance has been for the first quarter, we offer the following

Don't Get The Weekly Newsletter? Join Here:
Of course, we are not suggesting that it will be a straight line up and not come close to the annualized returns shown above, but it is important to keep in sight just how big these returns are for 3 months.
Remember, this is a continuation of November/December, which saw an approximately 20+% return in several of these indices.
A longer-term look at the S&P 500.
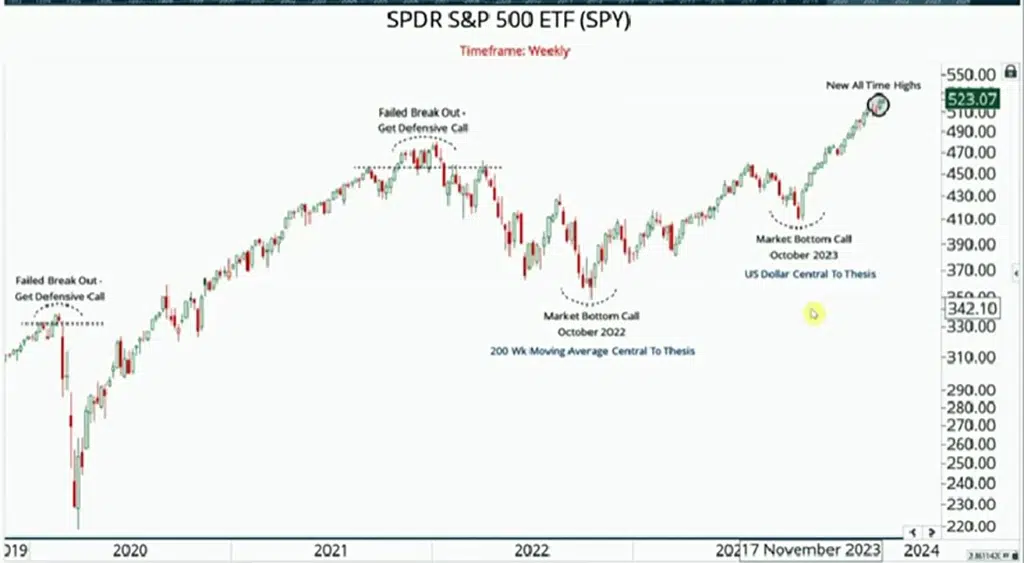
While we noted the numerous new all-time highs and expanding breadth above, we also want to show you the beautiful technical move that the S&P 500 index has made in the chart below:
In recent Market Outlooks we have pointed out that it is important (and necessary) for the soldiers (small-cap stocks) to begin to participate along with the generals (mega and large-cap stocks) that have been the major drivers of cap-weighted stock market indices in the past 18 months.
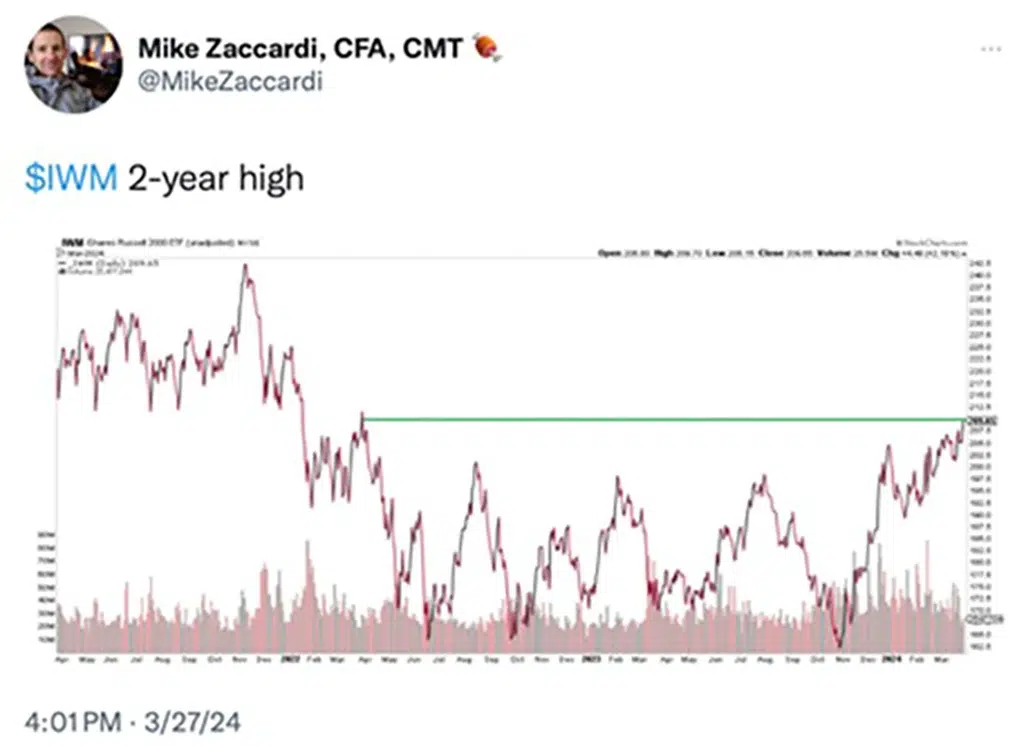
Finally, the IWM just made a 2-year high. The question is, will this positive small-cap momentum continue with a clear and decisive breakout? If so these types of stocks may explode much higher.
This was something many of the analysts were forecasting and have been anxiously waiting for. A further move would give proof that the BULL market will continue (more on that later). See IWM chart below:
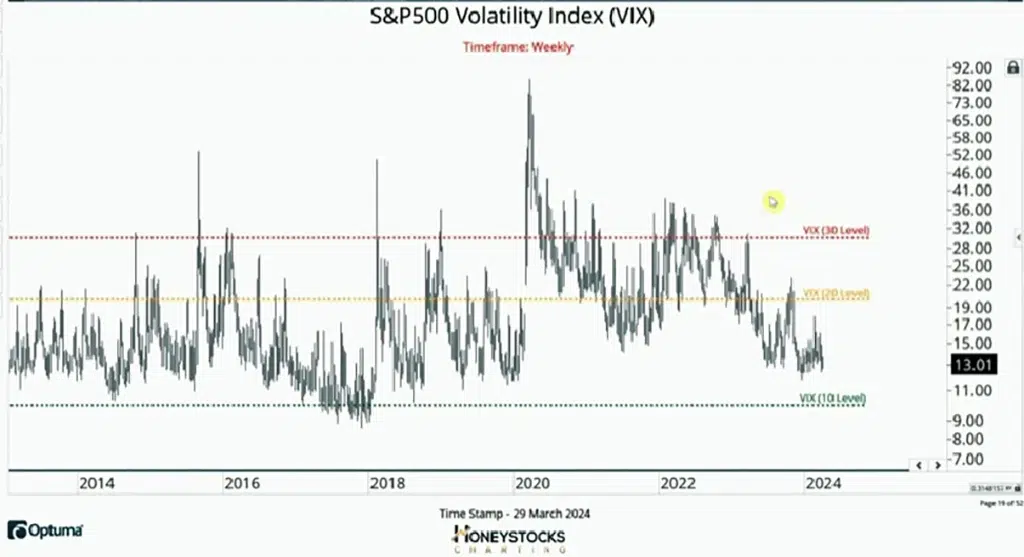
Volatility remains low. The absence of fear is also helping to drive stock prices higher. Option pricing, which is directly tied to volatility, is not projecting much fear. Therefore, market insurance/protection (puts) is low and with speculative option prices (calls) also low, this is attracting speculators to want to take positions. Higher priced option positions (writing puts and calls) are not offering high credit premiums that would normally accompany a higher volatility market. This is helping to pull money into outright long positions and help institutional investors rebalance portfolios to a higher allocation to equities than we might see in a fearful market. See the volatility chart below:
Let’s examine the quarterly performance more closely:
Use the links below to continue reading about:
- The biggest winning and losing stocks in 2024
- The leading and lagging sectors in 2024
- Why metals and commodities are likely to move higher
- What to expect from stocks in April and for the remainder of the year
- The weekly Big View bullets
- Keith’s weekly video analysis


