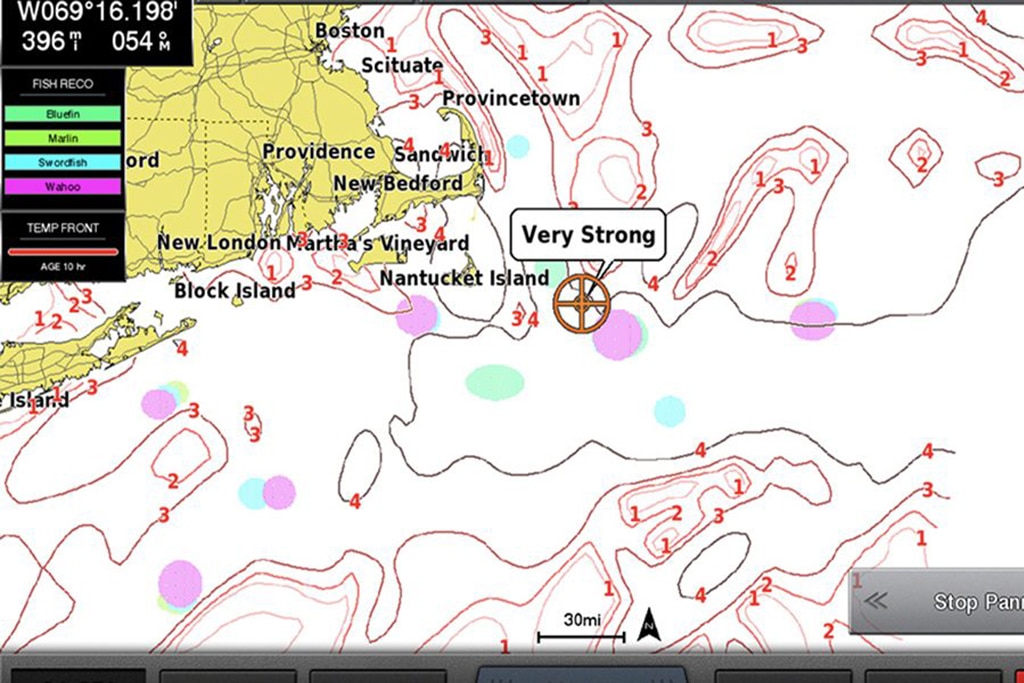
Okay, so say you’re in a fishing tournament and as you head out to catch fish, most of the boats head north. But a little birdie tells you that conditions are much better south. Following information provided by SiriusXM’s Fish Mapping service on their multifunction display (MFD), the team headed south, and on that day, they won the tournament.
What it Does
The SiriusXM Fish Mapping service provides up-to-date information that is broadcast directly on your MFD via satellite. It’s not cell-based or Internet-based, and there’s no app for it. The data is provided by a partnership with Maxar, a space technology and intelligence company and the force behind Google Earth imagery, that offers near real-time monitoring of ocean and weather conditions. The data runs through your weather receiver and has complete coverage over the U.S. and most of Mexico and Canada extending 150 to 200 miles offshore, far beyond the range of cellular networks.
“There are eight dedicated pelagic fishing-specific features for fish mapping,” says Geoff Leech, SiriusXM’s senior director, marine services. “Three sea temperature options, two plankton options, weed lines, fishing recommendations, and sea height.”
Sea Surface Temperature Contour, Front Strength, Subsurface Temperature: “Probably the most prominent features are the sea surface temperature fronts,” says Leech. “We show you where the biggest fronts are between one body of water sea temperature and the next, and we’ve labeled them from one to four (one is weak, four is strong), so optimally, you’re looking for that temperature break, that front where really warm water is next to a lot colder water.” Contour lines on the display show noticeable breaks, and Front Strength identifies steep temperature changes where nutrients concentrate, both attracting baitfish. Subsurface Temperature measures water temps more than 90 feet below the surface that some fish species prefer and allows you to target where they are likely to be hunting.
Plankton Concentration: Plankton is the primary food source for most baitfish. Contour lines identify where they are, and the front strength option shows the greatest plankton concentrations where murky, nutrient-rich water favorable for baitfish occurs next to clear, predator-preferred water.
“Where a strong plankton front and a strong sea surface temperature front collide or overlap shows a much more probable area of finding the baitfish that attract the pelagic fish,” says Leech.
Weed Lines: Their oceanographers take various reports and images from satellites and run them through an algorithm to figure out the locations of the most prominent patches of sargassum weed. Contour lines show their approximate locations. “This is really a service for offshore anglers and not the near-shore guy,” says Leech. Because of interference, weed lines are rarely shown within 25 miles of the shoreline. Floating plants provide nutrients and cover that create habitats for baitfish, shrimp, etc., which attract larger, predatory game fish.
Fishing Recommendations: This feature maps locations that oceanographers recommend for finding specific types of game fish based on their expert analysis. This tailored information helps you find the type of game fish you’re looking for, faster. “We currently have six species of pelagic fish in it,” says Leech. “You can click on mahi, swordfish, billfish, tuna and see where the recommendations are offshore. But it’s really important to note that fish recommendations really only appear when conditions for each species are perfectly ideal.” If not, recommendations won’t be noted.
Sea Surface Height Anomaly: Using real-time radar data and models to locate “upwelling” areas that create favorable conditions, including nutrient-rich water that attracts baitfish and game fish, are shown in this feature. It also works the other way to avoid “downwelling” areas that are nutrient-poor and don’t support favorable fishing conditions.
“There is nothing on the market that allows you to see fishing-specific options for pelagic anglers on your display via satellite,” says Leech. “You need to have a weather receiver, which is the piece of hardware and antenna that connects via ethernet to your marine chartplotter and brings in the signal, but to be clear, fish mapping is a superset, so once you have the fish mapping tier of service, it includes all the weather features.”
It’s the weather service that got SiriusXM into the maritime field. Offshore, radar has its limitations because you only see the front of storm and are unable to see the entire system and watch it build. “To see weather radar and lightning right on your display screen allows you to make some very educated decisions,” he adds. “Go, no go, try to split storm cells, run around them, duck in for cover, whatever it is, that is absolutely, without a doubt, critical for anybody who is offshore, especially if in a center console or exposed flat skiff or something with no place to shelter.”
For $99.99/month, you get the weather package ($59.99) and the Fish Mapping service. Fish Mapping is now available for Furuno’s NavNet TZtouch3 line, Garmin’s GXM 54, and Simrad’s WM-4 receivers and compatible displays. siriusxm.com/marine


