August 30, 2023
Weekly Market Outlook
By Donn Goodman and Keith Schneider
We hope our Southern Boating readers have had an enjoyable and more profitable week. Perhaps you are winding up summer where you reside. If you are in the South, in Florida and taking refuge from Idalia, we pray for your ultimate safety and that the storm passes quickly with little to no damage to vital areas.
Staying the Course
Last week we heard from several past Fed Governors as well as current ones. All thought that the Fed had done enough and now it is time to take a “pause”. However, when Chairman Jerome Powell spoke on Friday morning, his words conveyed the same narrative we have heard consistently over the past two years. While acknowledging that inflation has cooled, he reiterated that the Fed still needs to continue to do more. The words he chose to use imply that the Fed is willing to do whatever is necessary to get to their target 2% inflation rate.
Chair Powell says that the US central bank is prepared to raise rates further if need be, and they intend to keep borrowing costs high until inflation gets to their target of 2%. Remember, the Fed has increased rates 11 times since it began this tightening campaign and has pushed the benchmark rate to 5.25%-5.5%.
“Although inflation has moved down from its peak – a welcome development – it remains too high,” he said at the Federal Reserve’s annual conference at Jackson Hole, Wyoming this past week. He cautioned that the process “still has a long way to go, even with the more favorable recent readings.”
Initially, his remarks about continuing to raise rates jolted a positive stock market open, later in the day, the remarks seemed to have had a more calming effect on the markets, and they finished higher for the day.
Tom Garretson, Sr. Portfolio Strategist with RBC Wealth Management, said “Powell, as has been the case for some time, didn’t offer the markets anything revelatory on Friday – which was likely the goal. The market reaction looks consistent with the idea that the Fed is likely done raising rates over the near term.”
Long overdue pullback.
August has seen a pullback in the stock market. We have shown several charts in the past few weeks showing how constructive a 5% or more down move could be for a “new” bull market. It has been a longer than normal period since we saw even a 5% correction. See chart below:
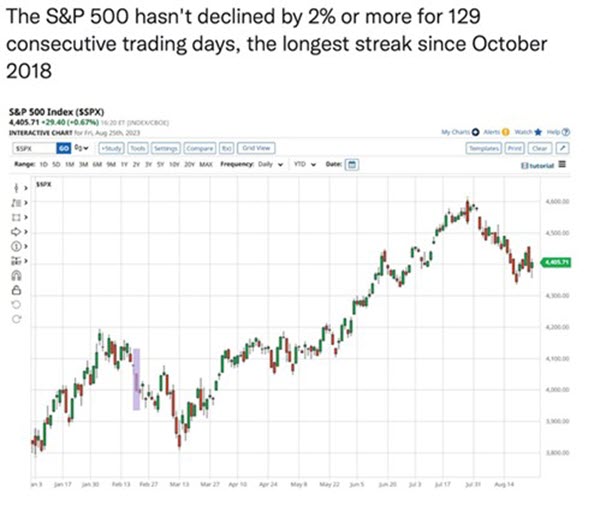
Some of the following areas that follow may appear negative. In fact, they may be reasons not to be negative on the markets as some of the charts and facts point to a possible future turn in the market weakness. Very often, when sentiment gets negative, or the # of stocks above the 20 & 50 day moving averages falls as much as we have seen in this recent period, along with a build up of cash, these are all signs that we could experience an explosive market move higher in the near-term. Or not. I guess it is in the way you decide to interpret it.

Sentiment weakness.
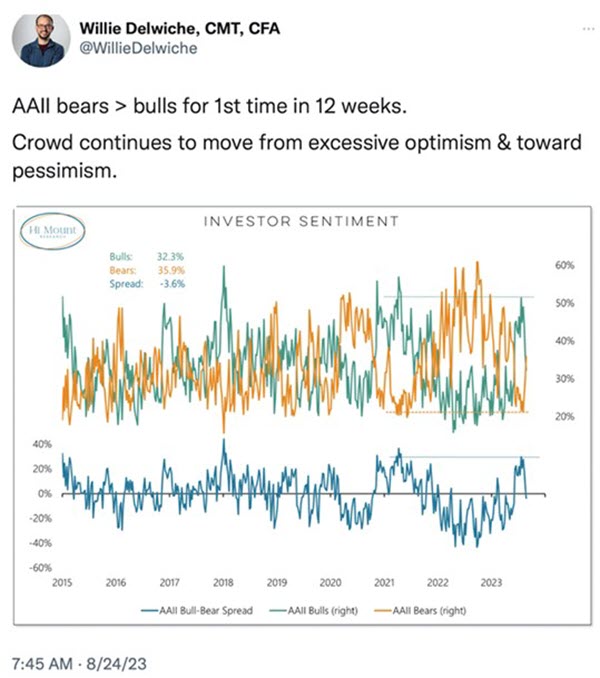
Investor sentiment readings, overly bullish/positive just a few weeks ago, have slipped recently. The AAII (American Association of Individual Investors) readings slipped these past few weeks, indicating that investors are becoming a bit more cautious than the positive readings during most of the summer. This can also be a contrarian indicator when these readings get too optimistic (July) or now much more pessimistic. See chart below:
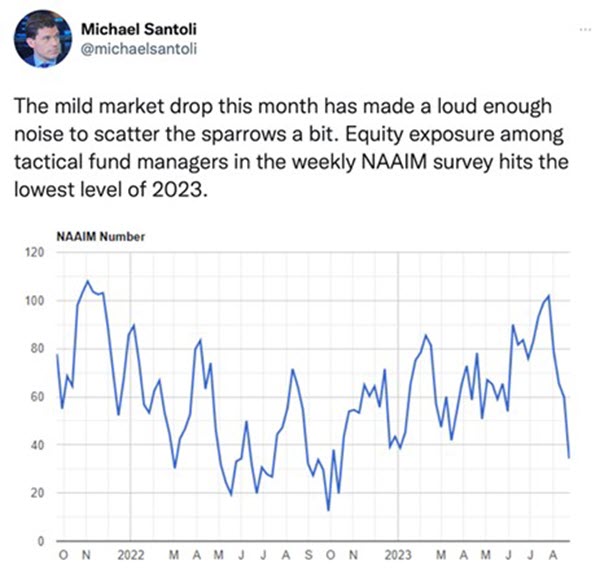
We have seen similar cautiousness in reviewing the NAAIM (National Association of Active Investment Managers – of which we would count MGAM and our strategies as part). Many of these stewards of other peoples’ assets have become more cautious recently and moved more defensive to preserve capital. See chart below:
Cash keeps growing.
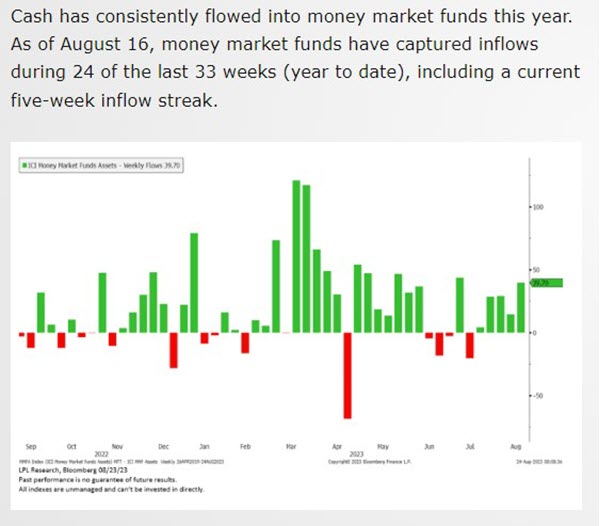
The above sentiment and defensiveness of tactical money managers illustrates that there are many investors who still don’t believe we are on solid footing in the markets. Still others are waiting for the next shoe to drop. How do we know? Cash (money market funds, T-bills, etc.) continues to grow in charts indicating the amount of money sitting on the sidelines.
We last reported that these “safe” investments (or non-investments) are well over $5.7 trillion. When we have enhanced volatility in the markets or a downward move, as we have witnessed during most of August, cash grows. See chart below showing positive flows into cash during all of August.
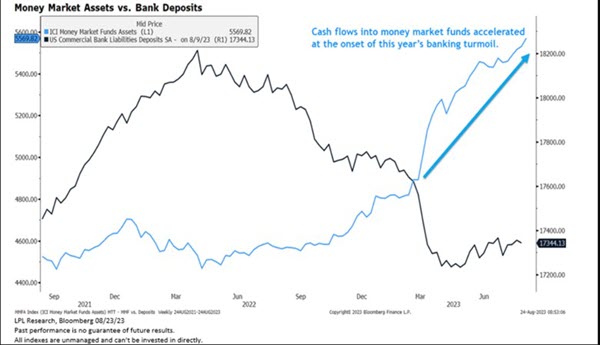
Even more interesting is the fact that since the collapse of a few regional banks (SVB), investors are staying away from depositing cash into banks (and Certificates of Deposits) and instead are using money market funds at their brokerage firms or buying T-Bills.
Some of our clients at our RIA, MGAM, have their assets at Interactive Brokers. Interactive is currently paying investors approximately 4.5% or more on cash that is uninvested in their accounts. This benefits MGAM investors as frequently we move to cash from stops and profit targets in most of our investment strategies. Here is a chart showing that investors are hesitant about using banks:
It’s all about AI
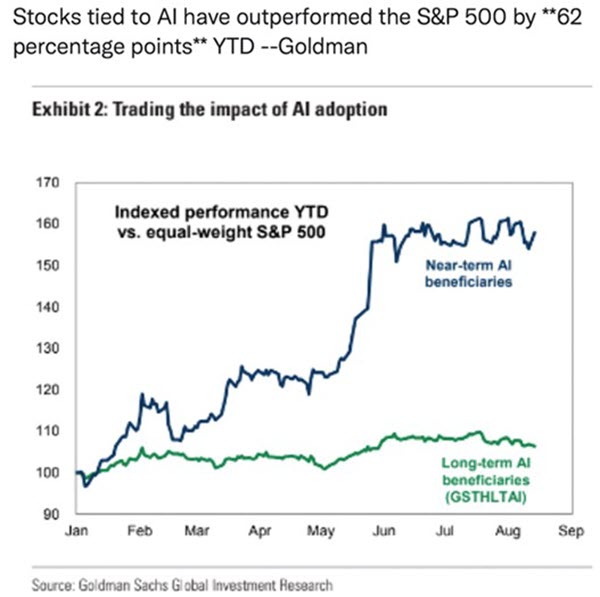
The difference between the capitalized weighted S&P 500 index (heavily influenced by the Magic 7 stocks Apple, Amazon, Google, Microsoft, Nvidia, and Tesla) and the equal-weighted S&P 500 is wide. As you will note, however, the stocks mentioned above all have one magical ingredient that is propelling investor enthusiasm – they all are integrating or incorporating AI (Artificial Intelligence) into their business models in some way.
The difference in performance of the stocks in the S&P 500 that are implementing the use of AI (Artificial Intelligence) and those that do not use or discuss AI is a whopping 62% difference. See chart below:
Nvidia: The leader (for now) of the AI revolution:
This past week, Nvidia came out with its earnings, blowing past analysts’ expectations for earnings and revenue. They were expected to earn $2.09 a share and announced $2.70 a share – a 429% increase over the past year. They also added over $2 billion more in revenue than expected this past quarter. Furthermore, they declared they would be purchasing up to $25 billion of their stock back).
The price of the stock has led all the mega-cap stocks on the S&P 500 and is responsible for a substantial amount of the cap-weighted S&P 500 index’s performance during 2023. Nvidia is certainly an important component of technology and a major driver of the AI revolution.
**************
Discover Your Investing Strengths
Are you investing in a way that leverages your strengths? These 10 simple questions will uncover how to approach the markets in a way that plays into your strengths so you succeed faster and with less effort.
**************
Seasonal weakness. Especially for Technology and other leading sectors.
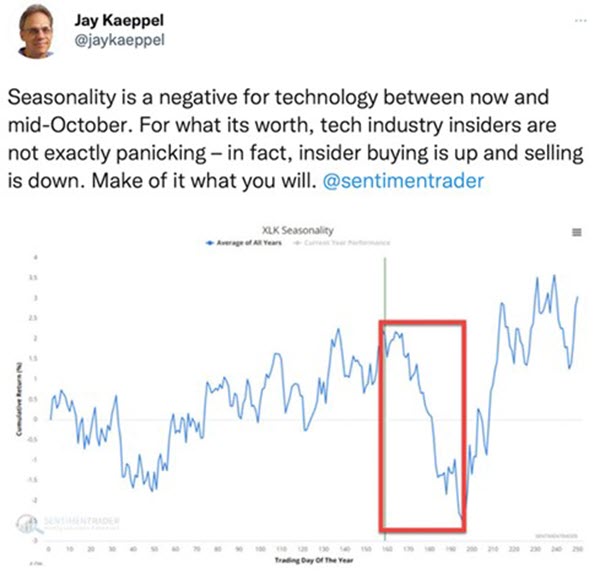
In recent Market Outlooks we have pointed out the seasonal weakness that has occurred historically during August to October. This is even more profound especially as it relates to pre-election years (or the 3rd year of a Presidential cycle). We continue to experience choppy markets with higher trend reversals intraday (like this past Thursday) and weakness in Technology, Semiconductor, and Industrial stocks. These have been the leaders thus far this year.
While the choppiness continued this past week, insiders of many of these stalwart technology companies continue to be “insider buyers”. Also, notice the chart below moves higher, historically, after we get through this period of seasonal weakness:
We show a chart of the NASDAQ 100 (QQQ). The tech heavy index keeps hitting its 50-day moving average. Last Thursday may have caused a bit of damage to the index. To see the NASDAQ chart and some technical levels we may have hit, continue reading from the link below. Also, you don’t want to miss the Interesting Facts section towards the end of the article.


