Dead Cat Bounce or Bottom?
What History Tells Us About the Near Future
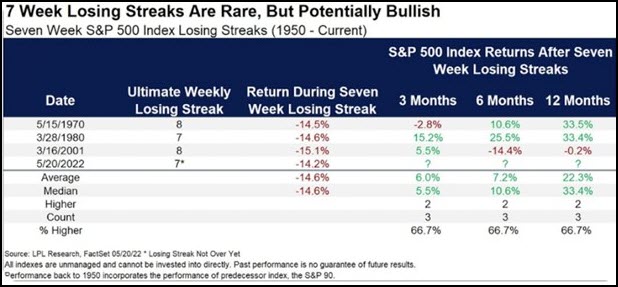
After 7 consecutive negative weeks for the S&P 500 (8 for the Dow), we witnessed a healthy reprieve this week.
The stage for this week’s rally was set by the prior week’s wild Friday (May 20th), during which the S&P 500 was down over 2% intraday and within a whisker of hitting the commonly accepted bear market designation of a 20% correction from all-time highs. However, as the media highlighted the bear market level, the market reversed and rallied to end the day in the green.
Monday’s follow-up rally created a 2-day pattern that market technicians (chart readers) could label as a reversal. Tuesday’s negative price action tested this idea, and then the healthy rallies that followed on Wednesday, Thursday, and Friday proved the pattern correct. The S&P 500 closed the week up 6.5% and over 9% higher than the prior week’s “bear market” low. It was the biggest weekly gain since Nov. 6, 2020 (+7.3%) and two other weeks that market the 2020 pandemic low.
More importantly, we finally had a positive week and broke the longest losing streaks since 2001 and 1932 in the S&P 500 and the Dow respectively.
While consecutive 7-week losing streaks are rare in the S&P 500, they are not without precedent. They often are indicative of weakening economic indicators. Many times, they precede downward earnings revisions. However, while rare, they are often followed by a future winning track record.
Many talking heads believe this week’s positive rally was due to the reporting of slightly lower indications of inflation. The April PCE (Personal Consumption Expenditure), a Fed favored stat, came in at 0.2% providing evidence that inflation may be peaking. Inflation may be slowing directly as a result of too high commodity prices, mortgage rates spiking, and general demand destruction.
This week, the beaten-up sectors experienced huge rebounds. Specifically, consumer discretionary, technology, and real estate were the leaders. As we noted in last week’s Market Outlook, this market moves fast and furious. More on that in the Big View section below.
Have we seen the bottom or is this just a bounce?
That will remain the big question. However, if you manage your investments tactically and actively rather than strictly buying and holding, there are opportunities in either outcome.
We have identified a number of indicators that you can use to gauge whether it is a good time to reenter the market. We’ve also included statistics that tell us about investing in a similar market environment. Please click here to read the article in its entirety.


