November 01, 2023
Weekly Market Outlook
By Donn Goodman
Hope you have weathered the volatile and negative stock (and bond) markets. We have described the negative cycle trends that can and do often take place in September-October. 2023 has certainly been amplified.
As all of us are traveling to The Money Show in Orlando (and I am sitting in a flying cylinder as I write this), this will be a shortened version of Market Outlook for this week. We hope that maybe you will be attending The Money Show this weekend through Tuesday and we may even get a chance to visit. If you are at the Show, please track us down. Mish is also speaking at several panels, workshops, and presentations. Hope you can attend!
As scary as Halloween can be, there is a lot going on around the world that may be scarier, including the economic uncertainty that plagues the United States at this time.
October has exceeded the scary expectations many pundits had about the potential downdraft of this historically weak and negative season.
So far in October, the major indices are down more than 3% month-to-date, with the Dow Jones down the least (-3.2%), the NASDAQ 100 (-3.6%) heavily influenced by the mega cap technology stocks (GOOG, NVDA, TSLA, MSFT, AMZ, AAPL and META-the Magnificent 7), who so far have reported better than expected earnings, except TSLA and GOOG which had mixed results. The S&P is down 3.9%, influenced by the 35% cap weighting of those same 7. The Russell 2000, the small cap index (IWM) is down over 8%, heavily influenced by the effect rising interest rates will likely have on these businesses, which are more dependent on financing and are more heavily leveraged than the cash rich mega caps.
Interest rates most dramatic effect is on smaller companies.
Last week we went into detail about the rise in interest rates and its potential effect on Price-Earnings ratios of the market and, more specifically, how analyst have to readjust their earnings expectations on companies including, cost of financing debt, inventory and reducing the leverage on their balance sheet as a result of higher interest rates.

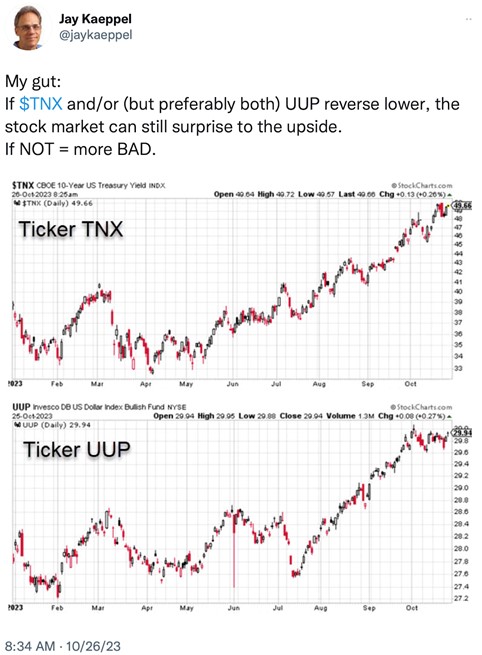
During much of 2022 and now since July 2023, the negative pressure on the stock markets has been the rapid rise of interest rates (earlier this week the 10-year touched 5.0%) and the strong dollar as investors around the world chase the high interest rate returns of money market funds and short duration bonds. (Money market funds with assets well over $6 trillion continue to see huge inflows). See the 10-year rate rise (TNX) as well as the US Dollar (UUP) increase in the graph below:

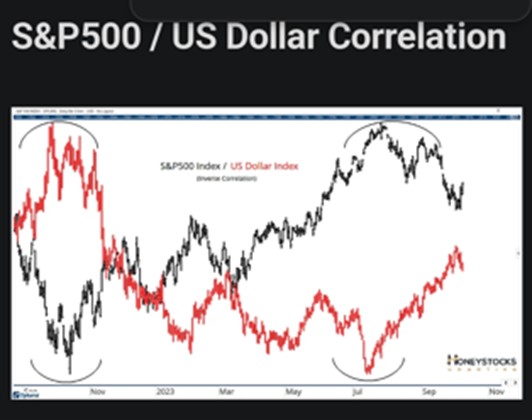
There is a very distinct and clear (negative) correlation between a strong and rising US Dollar and the sell off in the stock market. See chart below:

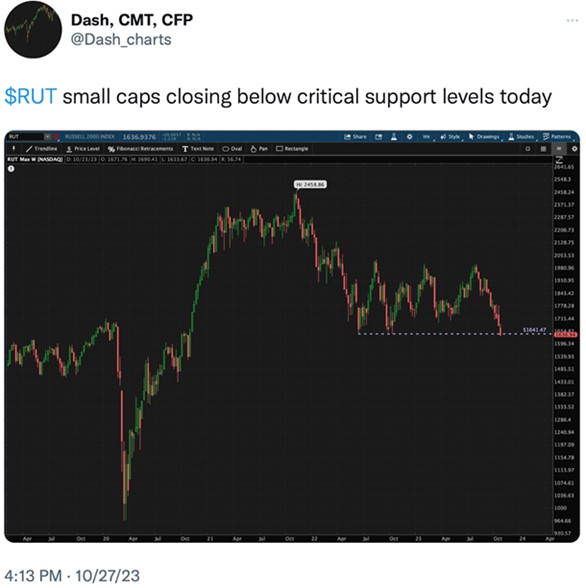
Nowhere has this been felt more dramatically than small cap stocks which are underwater year-to-date by 7% or more. (The IWM small cap index is down 6.9% year-to-date). Let’s take a look at a few Russell 2000 (IWM) small-cap stock graphs:

So far, over the past 5 years, small-cap stocks have produced a 0 return. See graph below:

Large versus small cap stocks.
Click here to continue reading about:
- Large versus small cap stocks
- Long-term trends and support
- 10% corrections
- Why November could start on an up note
- The Big View bullets


