Weekly Market Outlook
By Geoff Bysshe
MarketGauge Pro
January 15, 2025
Last week’s headline news event was the Friday jobs report, and everybody knew it.
However, it isn’t really the employment number that’s driving the current market in the short or intermediate-term direction of the market. Most market participants know this too.
The market tends to get focused on the one thing it wants to focus on and then that’s all that matters.
Right now, the market looks at the employment data through the lens of, “What’s it going to mean for inflation?”
With that point of view, the stronger than expected employment data gets translated into expectations that there will be continued upward pressure on inflation and interest rates. Additionally, it will be less likely that the Fed will continue to cut rates in the near term.
Right now, that expectation pushes long bonds lower (rates higher) and pressures stocks to move lower.
Last week, the major stock indexes succumbed to the pressure of higher rates and moved lower. No surprise there, as this is a continuation of a pattern that has clearly existed since December.
Later in this article, you’ll find a chart that clearly shows how the path of the stock market over the last 5 years has followed inflation expectations. This is likely to continue for the foreseeable future.
However, this relationship is also dependent on the bond market, and it has short and long-term trends.
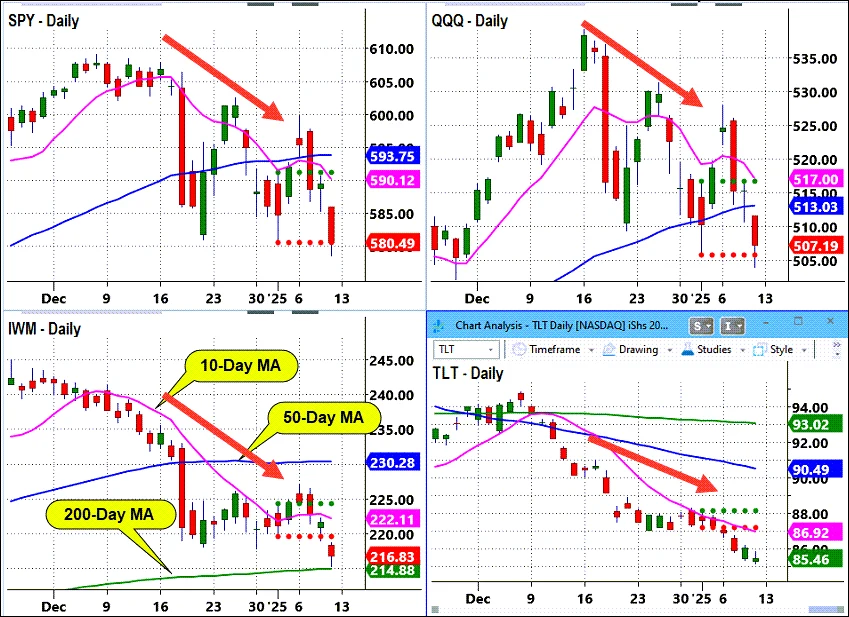
Currently, the stock market is in a high-risk zone in the short term with respect to this relationship, and you can see it playing out in the charts below.
In the chart below, all the red arrows begin on the 16th because the QQQ topped out on December 16th, approximately a week after the SPY and about a week after TLT resumed an existing downtrend with a vengeance.

The red and green dotted lines mark the high and low of the first day of the year, which provides context for people paying attention to the calendar ranges.
Note that with the exception of January 2nd, the TLT has made a new low every day this year. With the bonds (TLT) in a strong bearish market phase (price under the 50-day, which is under the 200-day), and acceleration of that trend is bearish for stocks.
Of course, “bearish for stocks” is a broad statement, so be sure to watch Keith’s weekly market analysis video and review the charts and bullets in Big View to see which segments of the market are most vulnerable, and if the market internals, sentiment or other factors present reasons to expect a technical bottom to form.
What Next?
This upcoming week is filled with the most widely watched inflation news. On Tuesday, we’ll get the PPI report, and on Wednesday, the CPI.
The important trends (above) are at levels and in trends that could lead to a big reaction in either direction.
The Good News
Even before we get the upcoming inflation data, the news situation and new flow are not all bearish.
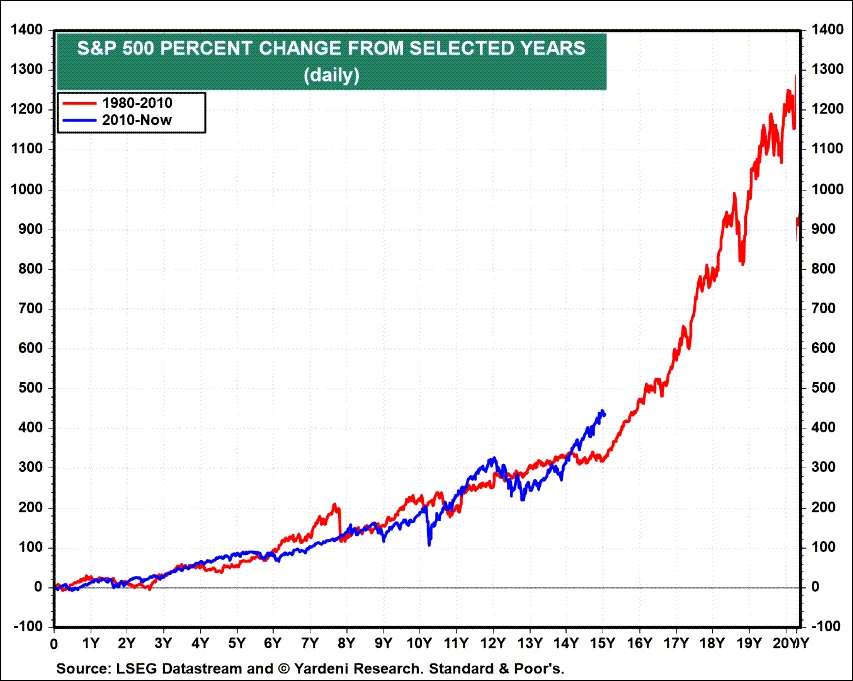
In fact, Ed Yardeni produced the chart below suggesting that if you look at the market from the long-term perspective, that equates the beginning of the current secular bull market as being 2010, and then compare it to the beginning of the secular bull market that began in 1980, we’re tracking it quite well. There’s even room to be optimistic even if we don’t experience an internet bubble 2.0.

Don't Get The Weekly Newsletter? Join Here:
What Does The Market Need to Get Back on Track?
Click the link below to continue reading about:
- What will put the bulls back in charge and send the market higher
- A clear view of how inflation expectations are driving the market
- The Big View Bullets
- Keith’s weekly market analysis video


