Weekly Market Outlook
By Geoff Bysshe
MarketGauge Pro
December 11, 2024

Last week began with traders’ expectations focused on the Friday employment report as the likely highlight of the week, but before that could happen…
- The AI animal spirits pivoted away from NVDA and ignited another phase of the AI bull market
- Fed Chairman Powell, speaking at the Deal Book Conference lit a match under Bitcoin and it blasted through the much anticipated $100k level
- Evidence of an optimistic consumer piled up
- Earnings reports and guidance sent more stocks flying high
- And by the time the employment numbers were released, it was hard to see them as anything other than uneventful
As a result, years from now, we may look back on this week and the conclusion of this quarter as one in which the market sent a clear message that the bull market was stronger and more durable than many expected.
In fact, this week and this quarter may set the stage for 2025 to be analogous to the state of the Dot.com bull market in 1995.
The fact that both years end in 5 is not insignificant, but it’s not part of this analogy and will be covered in an upcoming issue of this column.
Politics, Animal Spirits, and Market Trends
In last week’s Market Outlook, we pointed out the similarity between 2016 and the market’s current strong reaction to the new Trump 2.0 led administration. More importantly, we suggested that the continuation of the market trend could hinge on the bond market’s direction.
We also emphasized an expectation that the market sectors that continued higher into the end of November would likely be the segments of the market that continue to lead into the end of the year.
So far, this perspective appears to be playing out.
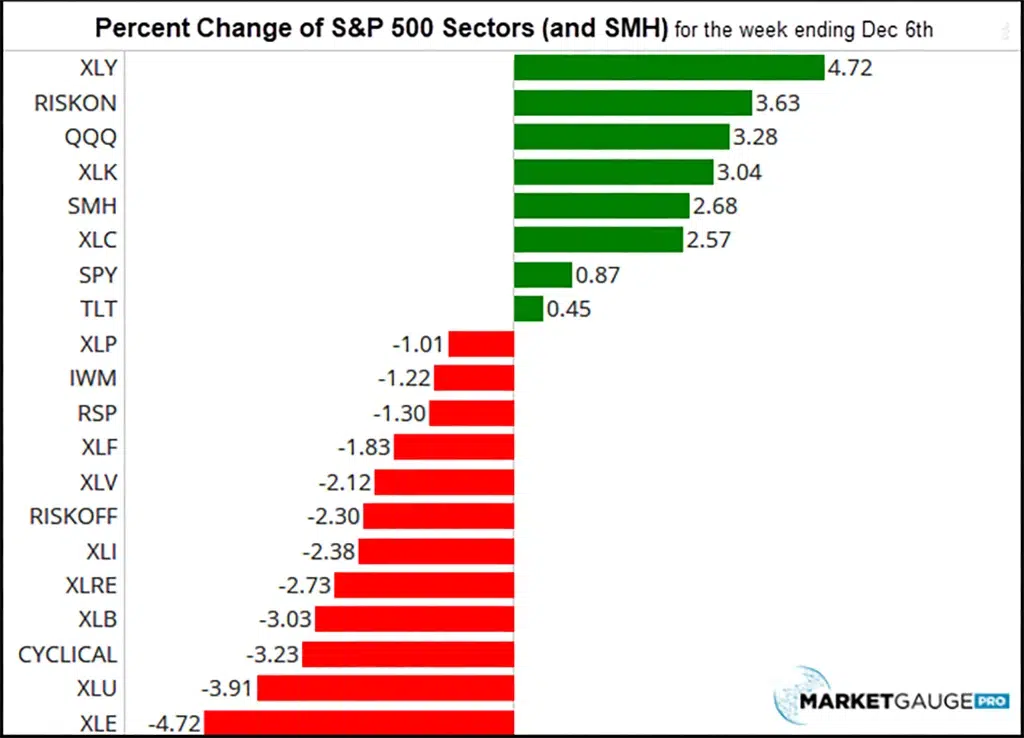
As you can see in the chart below of the percent change in the S&P 500 sectors last week, the Consumer Discretionary and the Risk On sectors continue to lead. The TLT’s sit conservatively near the breakeven line but positive.

For readers who are not members of our ETF Sector Plus membership, “RiskOn” (in the chart above) is the aggregation of sectors XLC, XLC, and XLY. “RiskOff” represents XLU, XLV, and XLP. “Cyclical” aggregates XLU, XLB and XLI. It’s a helpful way to see sector rotation.
Clearly, large-cap, technology and the consumer led the way.
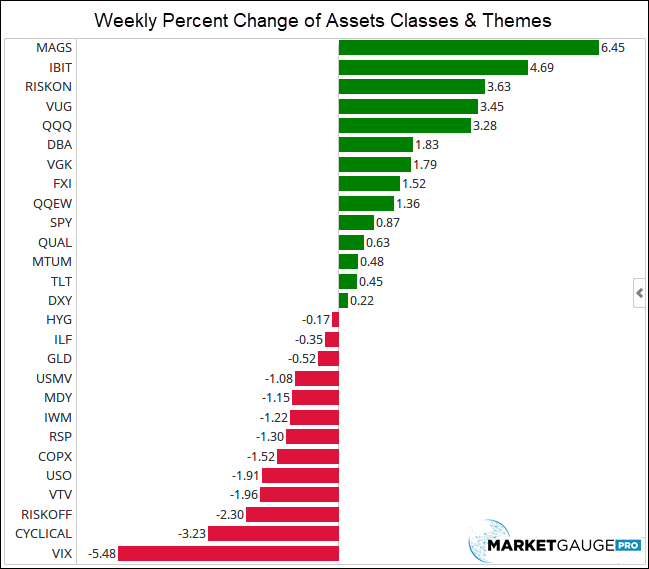
Looking at a broader perspective in the chart below, the same trends are apparent.
Don't Get The Weekly Newsletter? Join Here:

The top of the chart, “MAGS,” the ETF representing the Magnificent 7, and “IBIT”, Blackrock’s Bitcoin ETF, capture last week’s sentiment well, but there were equally important market messages last week that also show up in the order of this chart.
Bitcoin’s $100k Wake Up Call
This week, the Bitcoin ETF, IBIT, tops the chart above and reflects Bitcoin’s move through a major milestone of $100k.
Click the link below to continue reading about:
- New records of consumer enthusiasm
- The AI animal spirit driving the next wave of investing opportunities analogous to 1995
- Why tactical risk-managed investment strategies will be critical in 2025
- And more


